| Disease | Arm | Prevalence* | Sensitivity | Specificity | PPV | NPV |
|---|---|---|---|---|---|---|
| Gonorrhoea | SOC | 11% | 70% | 50% | 15% | 93% |
| Gonorrhoea | POC | 11% | 95% | 95% | 70% | 99% |
| Chlamydia | SOC | 7% | 70% | 50% | 10% | 96% |
| Chlamydia | POC | 7% | 95% | 95% | 59% | 100% |
| Trichomoniasis | SOC | 34% | 65% | 35% | 34% | 66% |
| Trichomoniasis | POC | 34% | 95% | 95% | 91% | 97% |
| Syphilis | SOC | 10% | 70% | 85% | 34% | 96% |
| Syphilis | POC | 10% | 90% | 95% | 67% | 99% |
Estimating the health impact of improved STI diagnostics
Most curable STIs in women are asymptomatic — the largest drop-off in the cascade from infection to cure. Downstream drop-offs are smaller but more intervenable: symptomatic care-seeking can be increased through demand generation and partner notification; correct treatment rates can be improved by point-of-care (POC) diagnostics; 12-month cure rates can be improved by partner notification and bundled prevention. This dashboard explores the modeled health impact of all four levers, alone and combined, in a Zimbabwe-calibrated STIsim model.
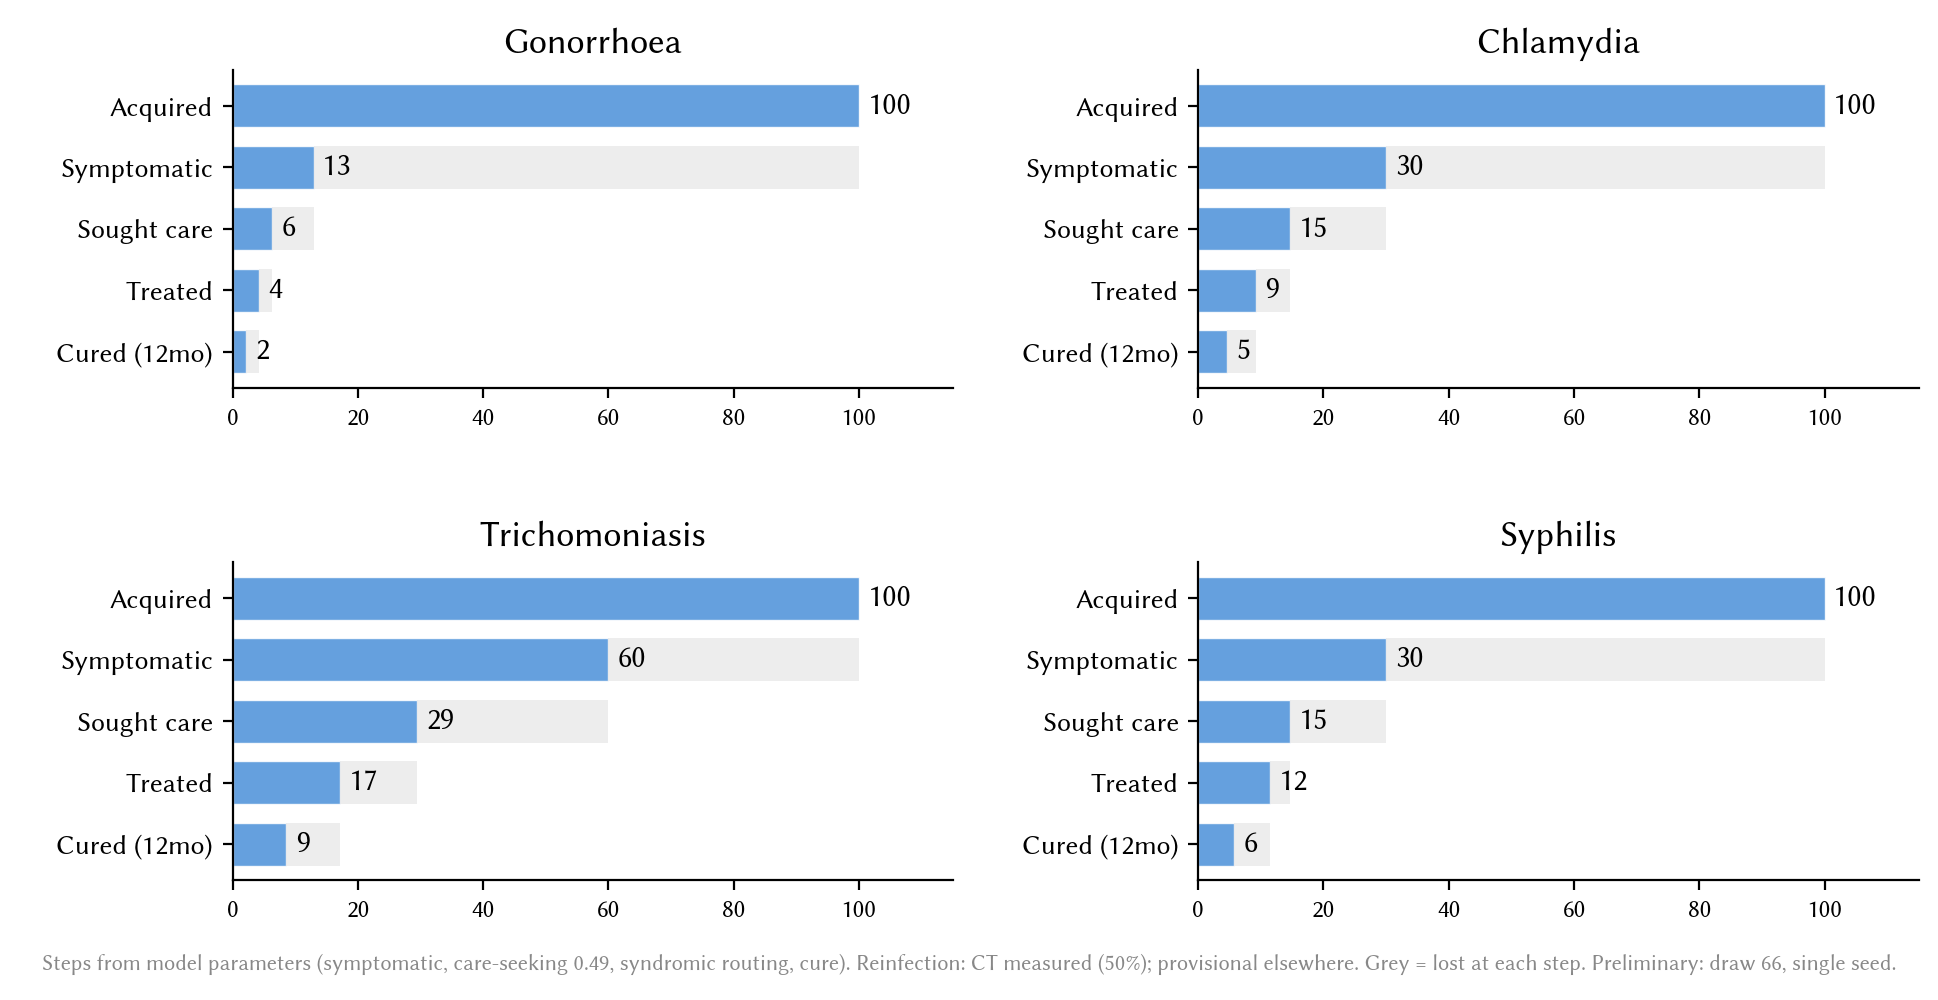
Steps from model parameters (symptomatic, care-seeking 0.49, syndromic routing, cure). Reinfection: CT measured (50%); provisional elsewhere. Grey = lost at each step. Preliminary: draw 66, single seed.
Syndromic management can’t distinguish between STIs, so treatment is symptom-based rather than infection-specific. POC diagnostics improve both sensitivity and specificity, but at the prevalences seen among women presenting with vaginal discharge syndrome, even a highly performant test leaves a meaningful share of false positives — POC narrows the overtreatment gap without closing it.
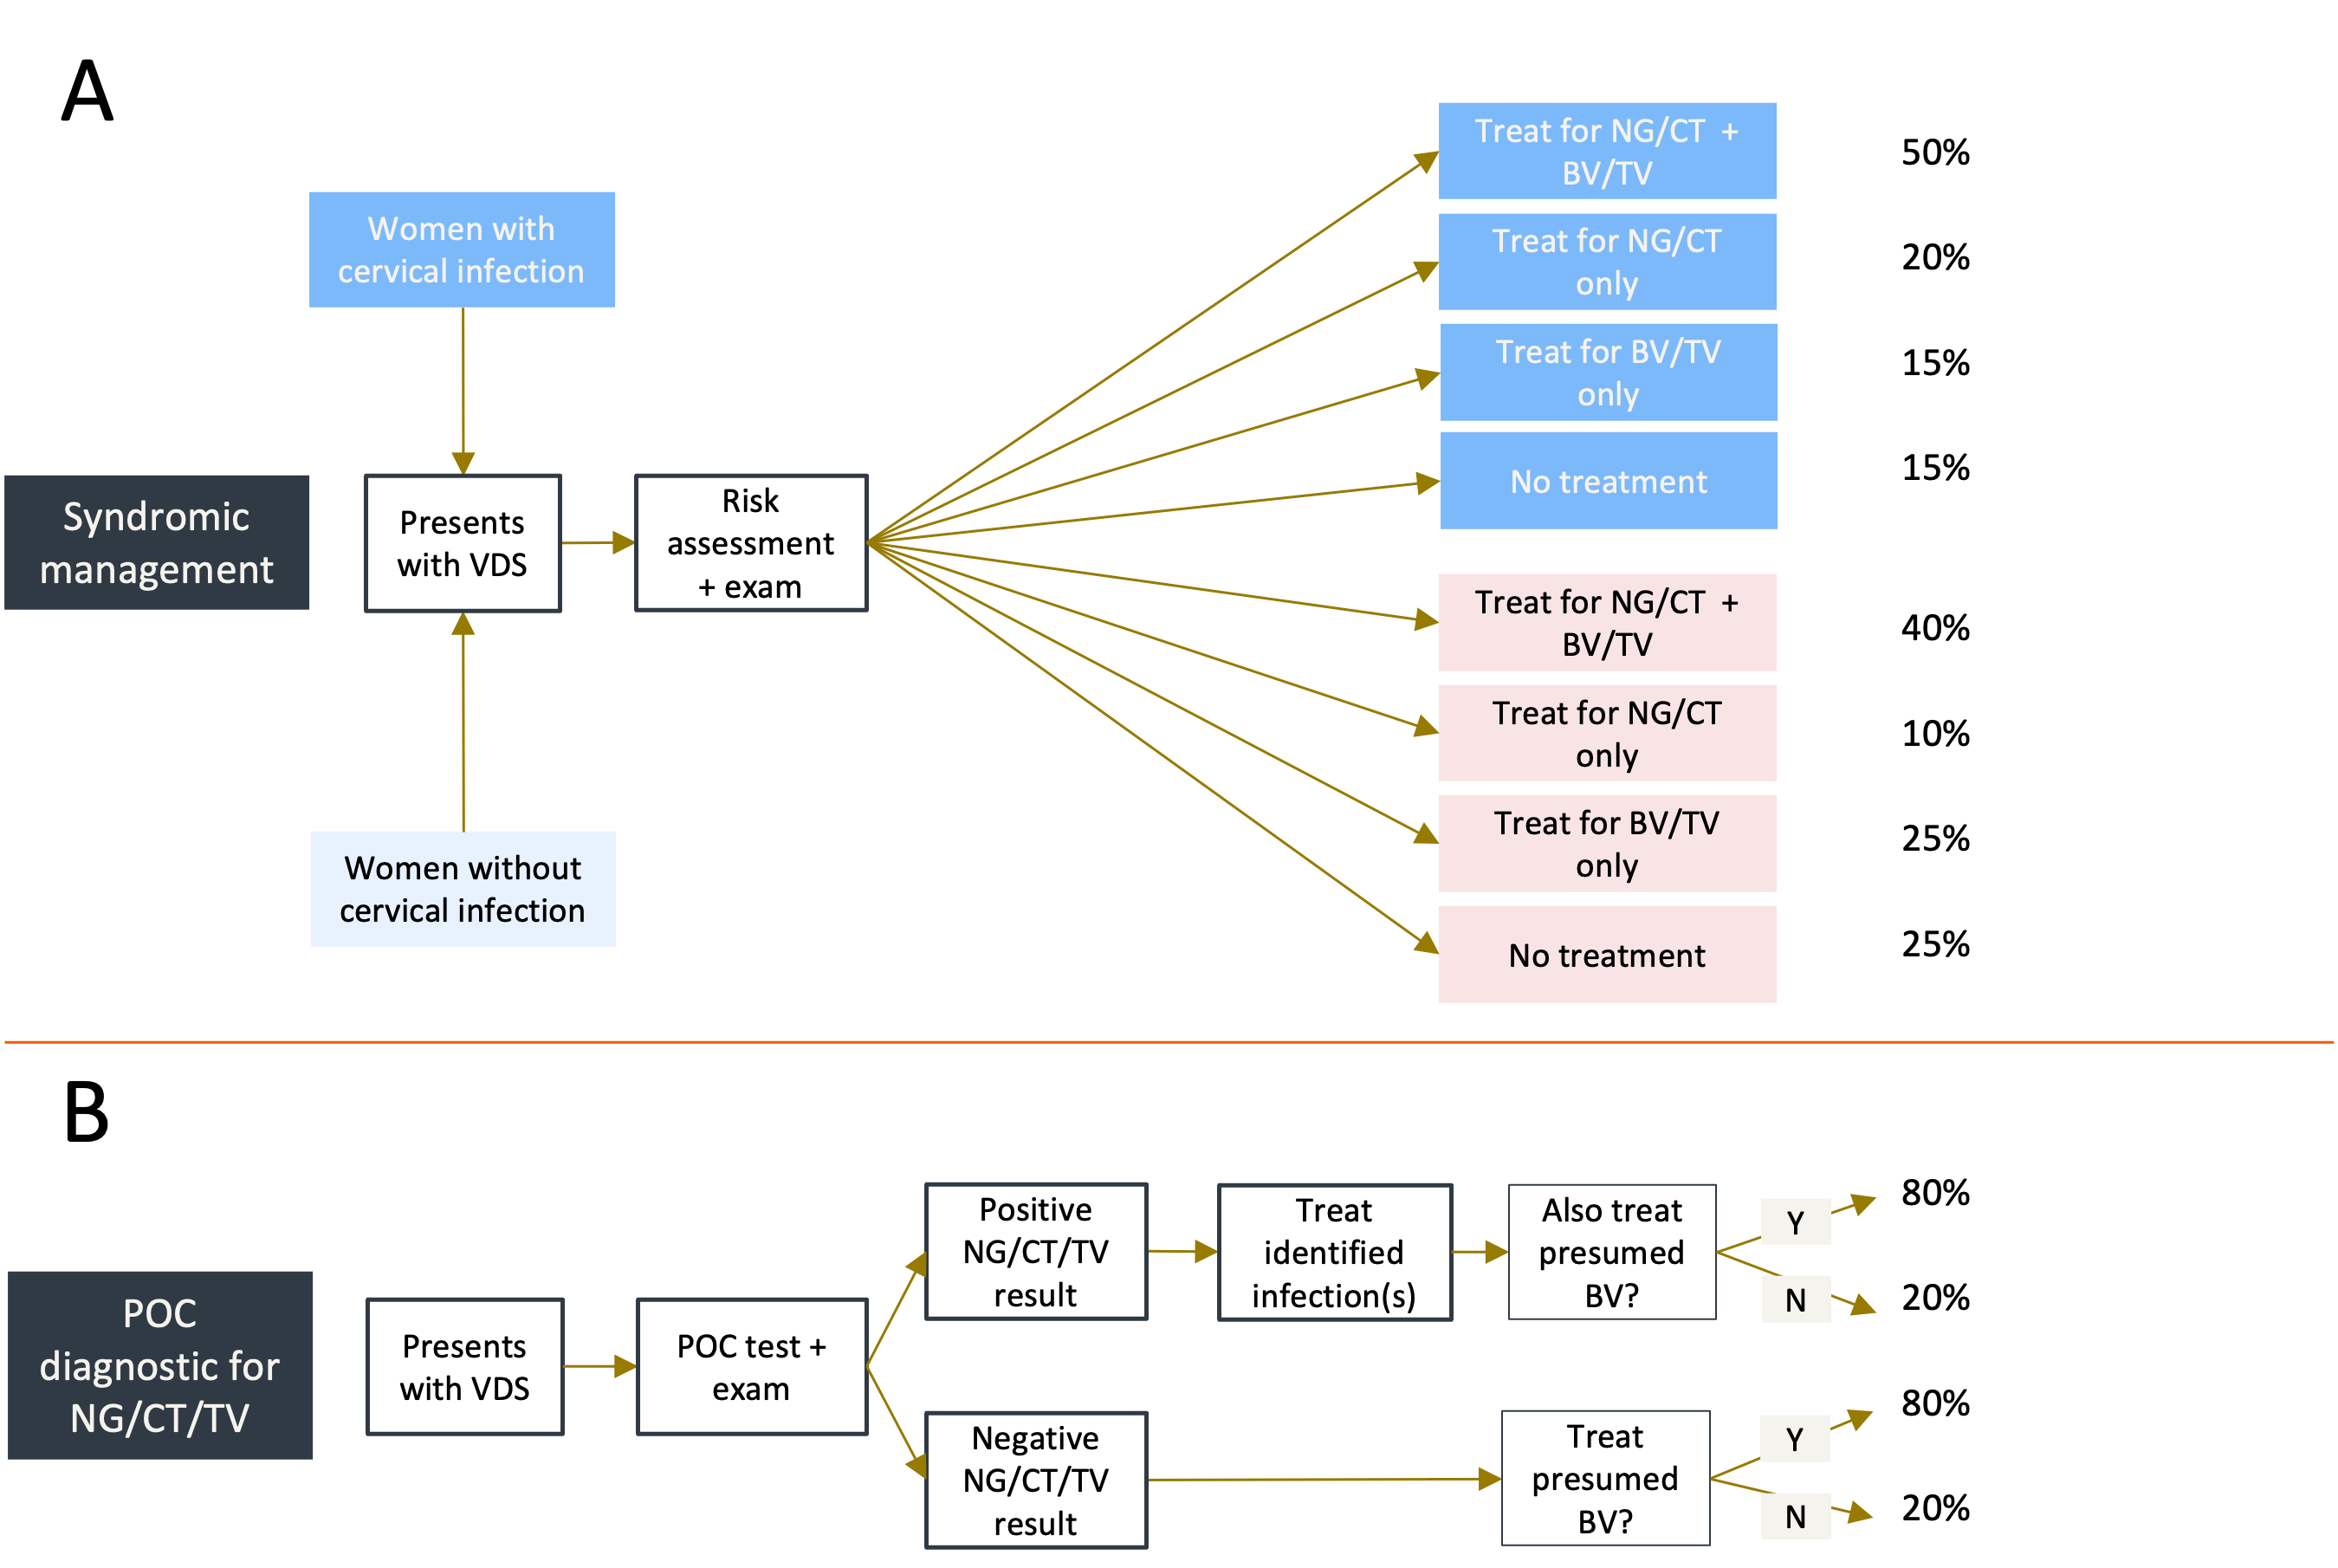
The two algorithms this dashboard compares as “SOC” and “POC”. (A) Syndromic management: a risk assessment and exam route women toward a spread of treatment outcomes that only loosely track true infection status — whether or not she has a cervical infection, some women are over-treated and some are missed. (B) A POC diagnostic for NG/CT/TV replaces the risk assessment with a test result, so treatment tracks the identified infection directly; presumptive BV treatment is unchanged. Reused from the companion VDS diagnostics analysis (stisim_vddx_zim).
But diagnostic accuracy only helps people who reach care. Roughly a third of symptomatic women in sub-Saharan Africa never seek treatment at all, and even treated index cases often don’t lead to their partners being notified and treated in turn — the gap this dashboard’s demand-generation scenarios (care-seeking, partner notification, bundled prevention) are designed to close.
Diagnostic performance, SOC vs POC
* Among women presenting with vaginal discharge syndrome.
The poor specificity of syndromic management leads to a sizable number of unnecessary treatments and unwarranted partner notifications.
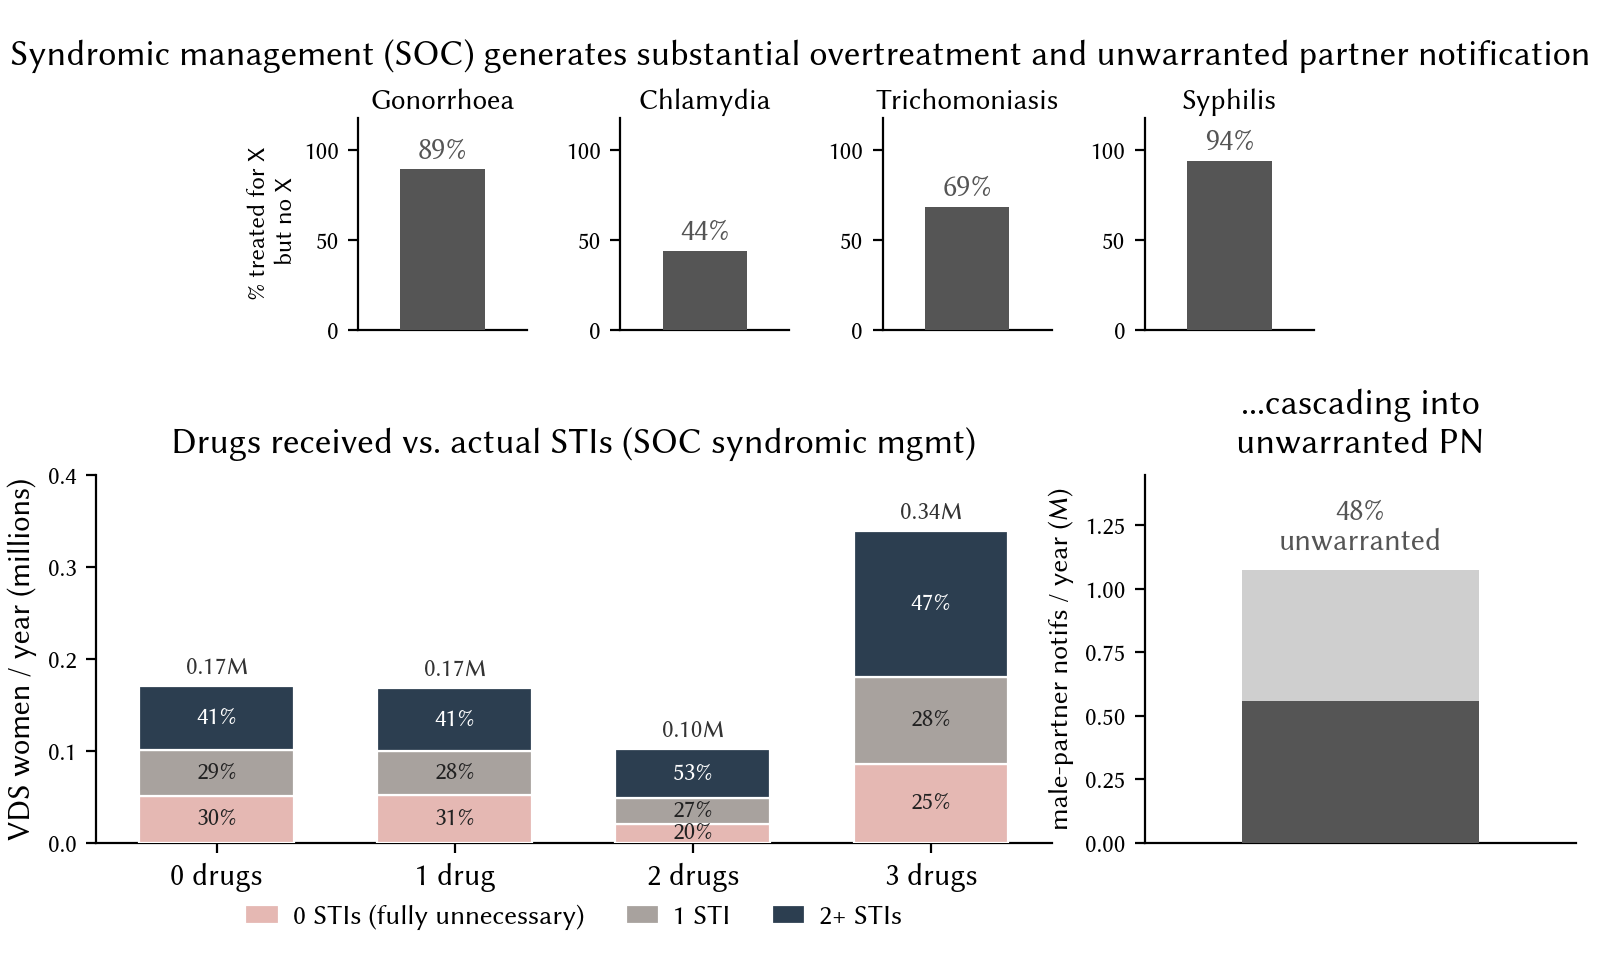
Despite improvements in sensitivity and specificity, low prevalence means we should temper our expectations around the reduction in overtreatment.
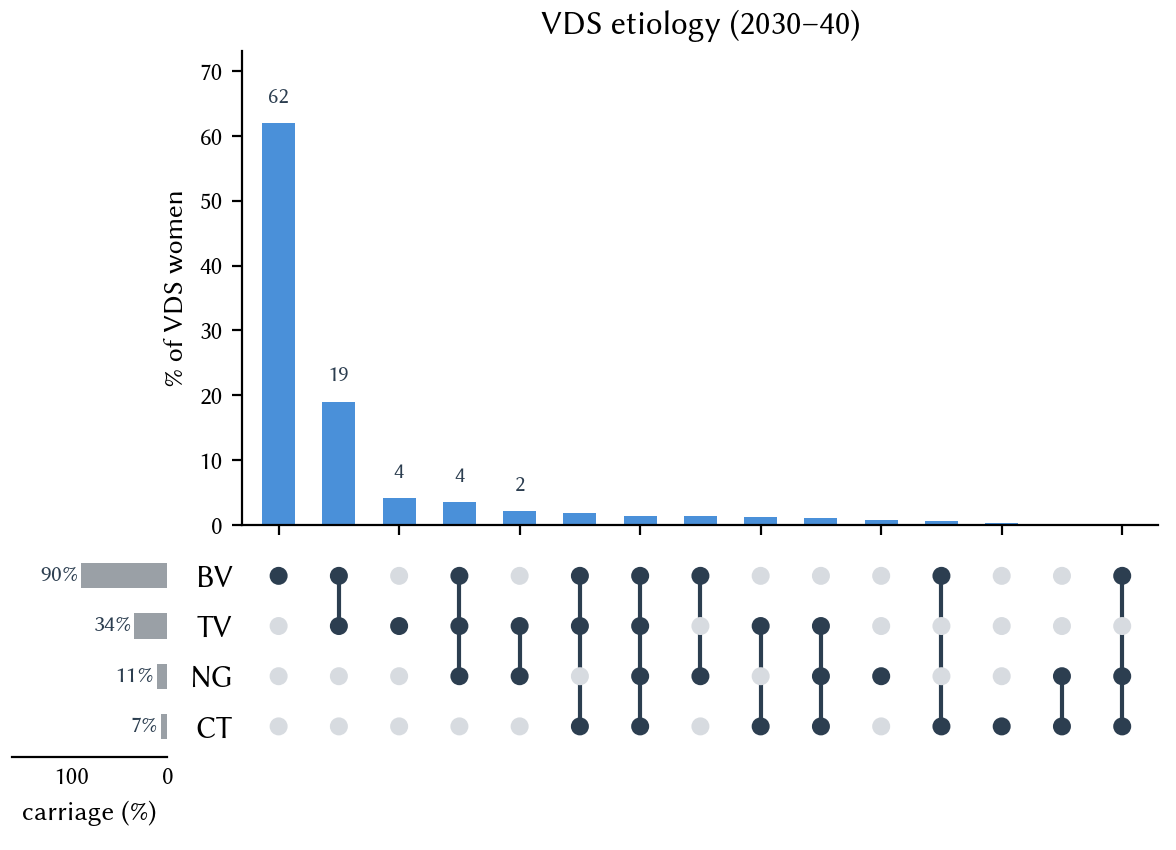
How do POC diagnostics help?
POC diagnostics will improve correct treatment rates, but cannot eliminate overtreatment or over-notification.
Adding POC diagnostics to syndromic management algorithms will not reduce prevalence or incidence.
What else can help?
There are also probably pathways from POC diagnostics to improved demand generation, partner notification, and bundled prevention. The scenarios below explore the roles of demand generation (care-seeking), partner notification, and bundled prevention alongside POC diagnostics, each on a baseline/low/moderate/high intensity ladder.
| Level | Care-seeking (× mult.) | PN — stable: notify / attend f,m | PN — casual: notify / attend f,m | Bundled prevention: coverage |
|---|---|---|---|---|
| baseline / none | 1.0× | 20% / 80%, 50% | 10% / 50%, 25% | 0% |
| low | 1.25× | 35% / 85%, 60% | 25% / 60%, 40% | 25% |
| moderate | 1.5× | 55% / 90%, 70% | 45% / 70%, 55% | 50% |
| high | 1.8× | 75% / 92%, 80% | 65% / 80%, 70% | 75% |
Bundled prevention: 50% relative-susceptibility reduction for 6 months while enrolled, fixed across levels — coverage of diagnosed/treated agents enrolled is the only varying parameter.
Combined strategies
POC diagnostics + partner notification can decrease prevalence, but incidence remains high due to reinfection.
POC diagnostics + bundled prevention can decrease prevalence and incidence.
POC diagnostics + bundled prevention + care-seeking could effectively quash syphilis, trichomoniasis, and chlamydia.
Scenario explorer
Check any combination of care-seeking, partner-notification, and bundled-prevention intensity levels to compare them side by side, across all four diseases. SOC (no POC, no added levers) is always shown as the gray reference.
Methods
Model. STIsim simulation of HIV, syphilis, gonorrhoea (NG), chlamydia (CT), trichomoniasis (TV), and bacterial vaginosis (BV) in Zimbabwe, with structured sexual networks and partner-notification edges. The custom slot wires a FetalHealth connector for adverse pregnancy and birth outcomes.
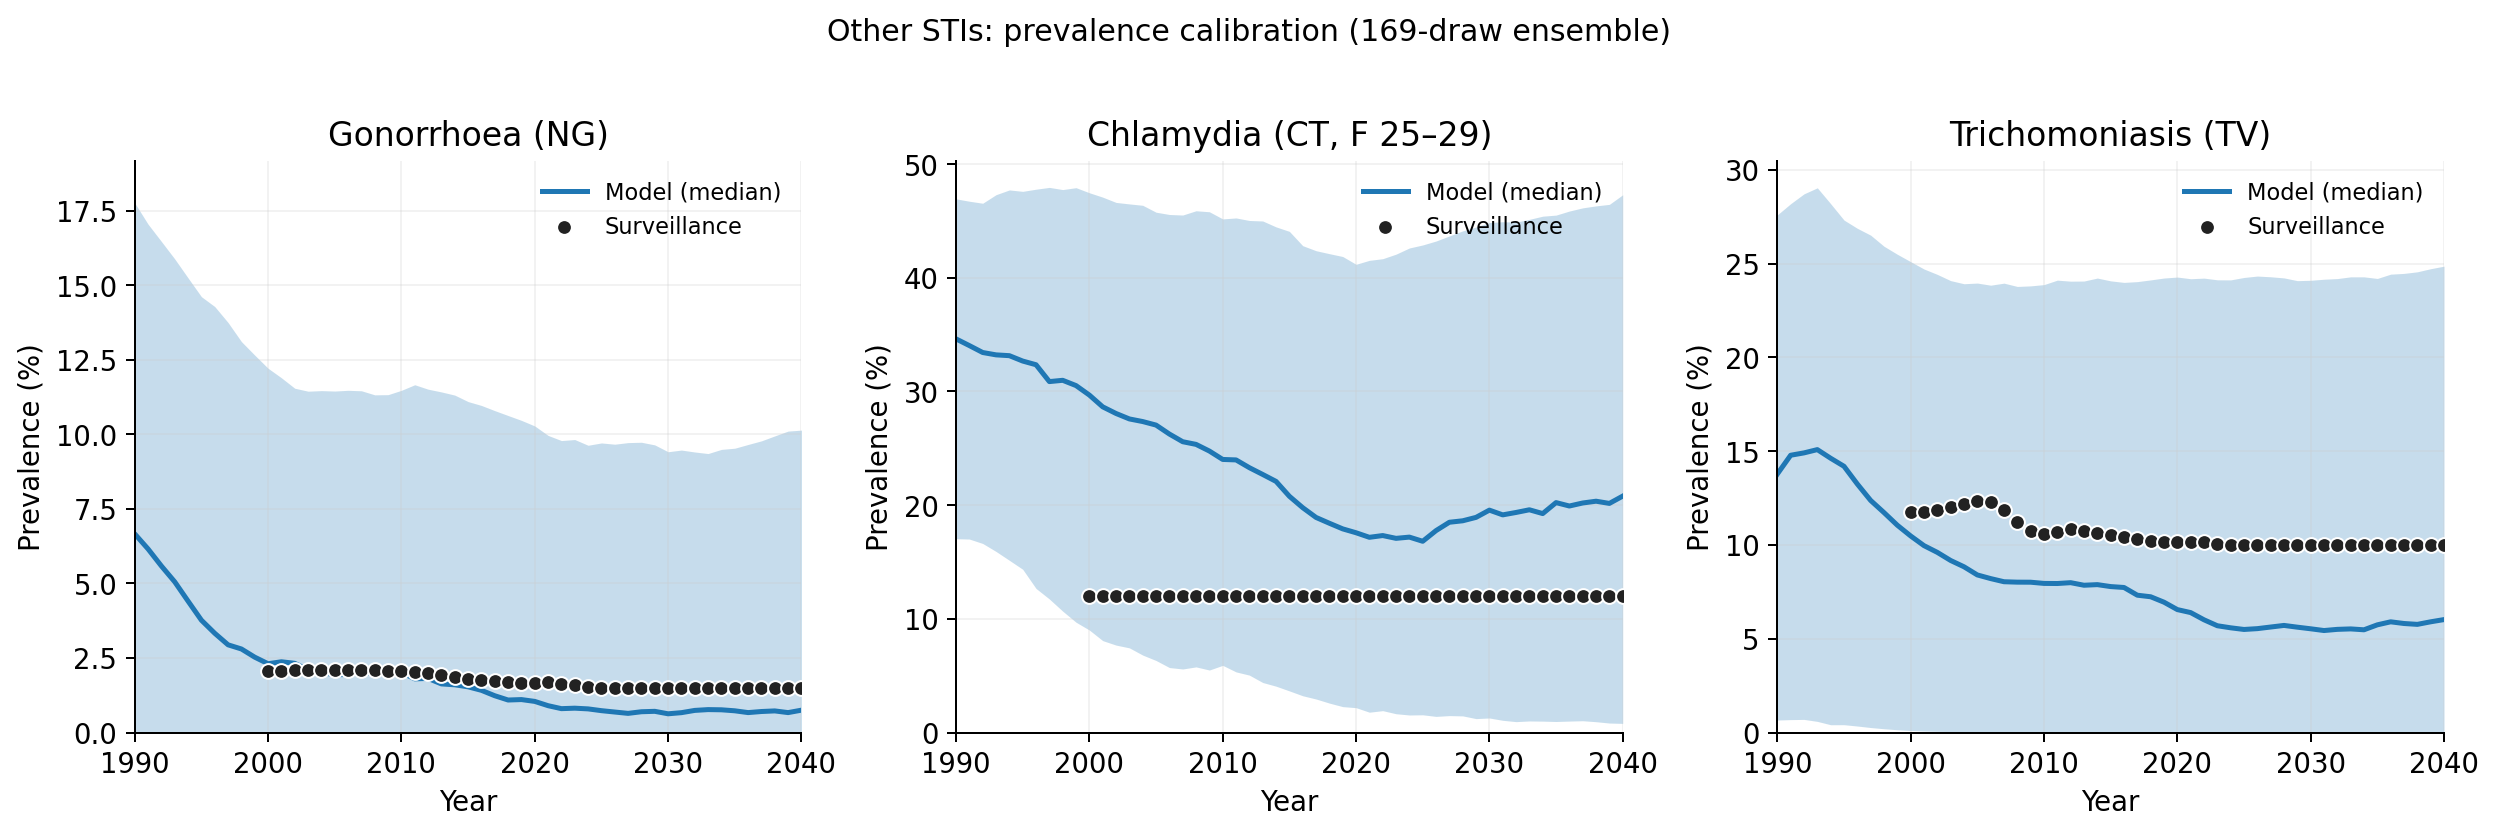
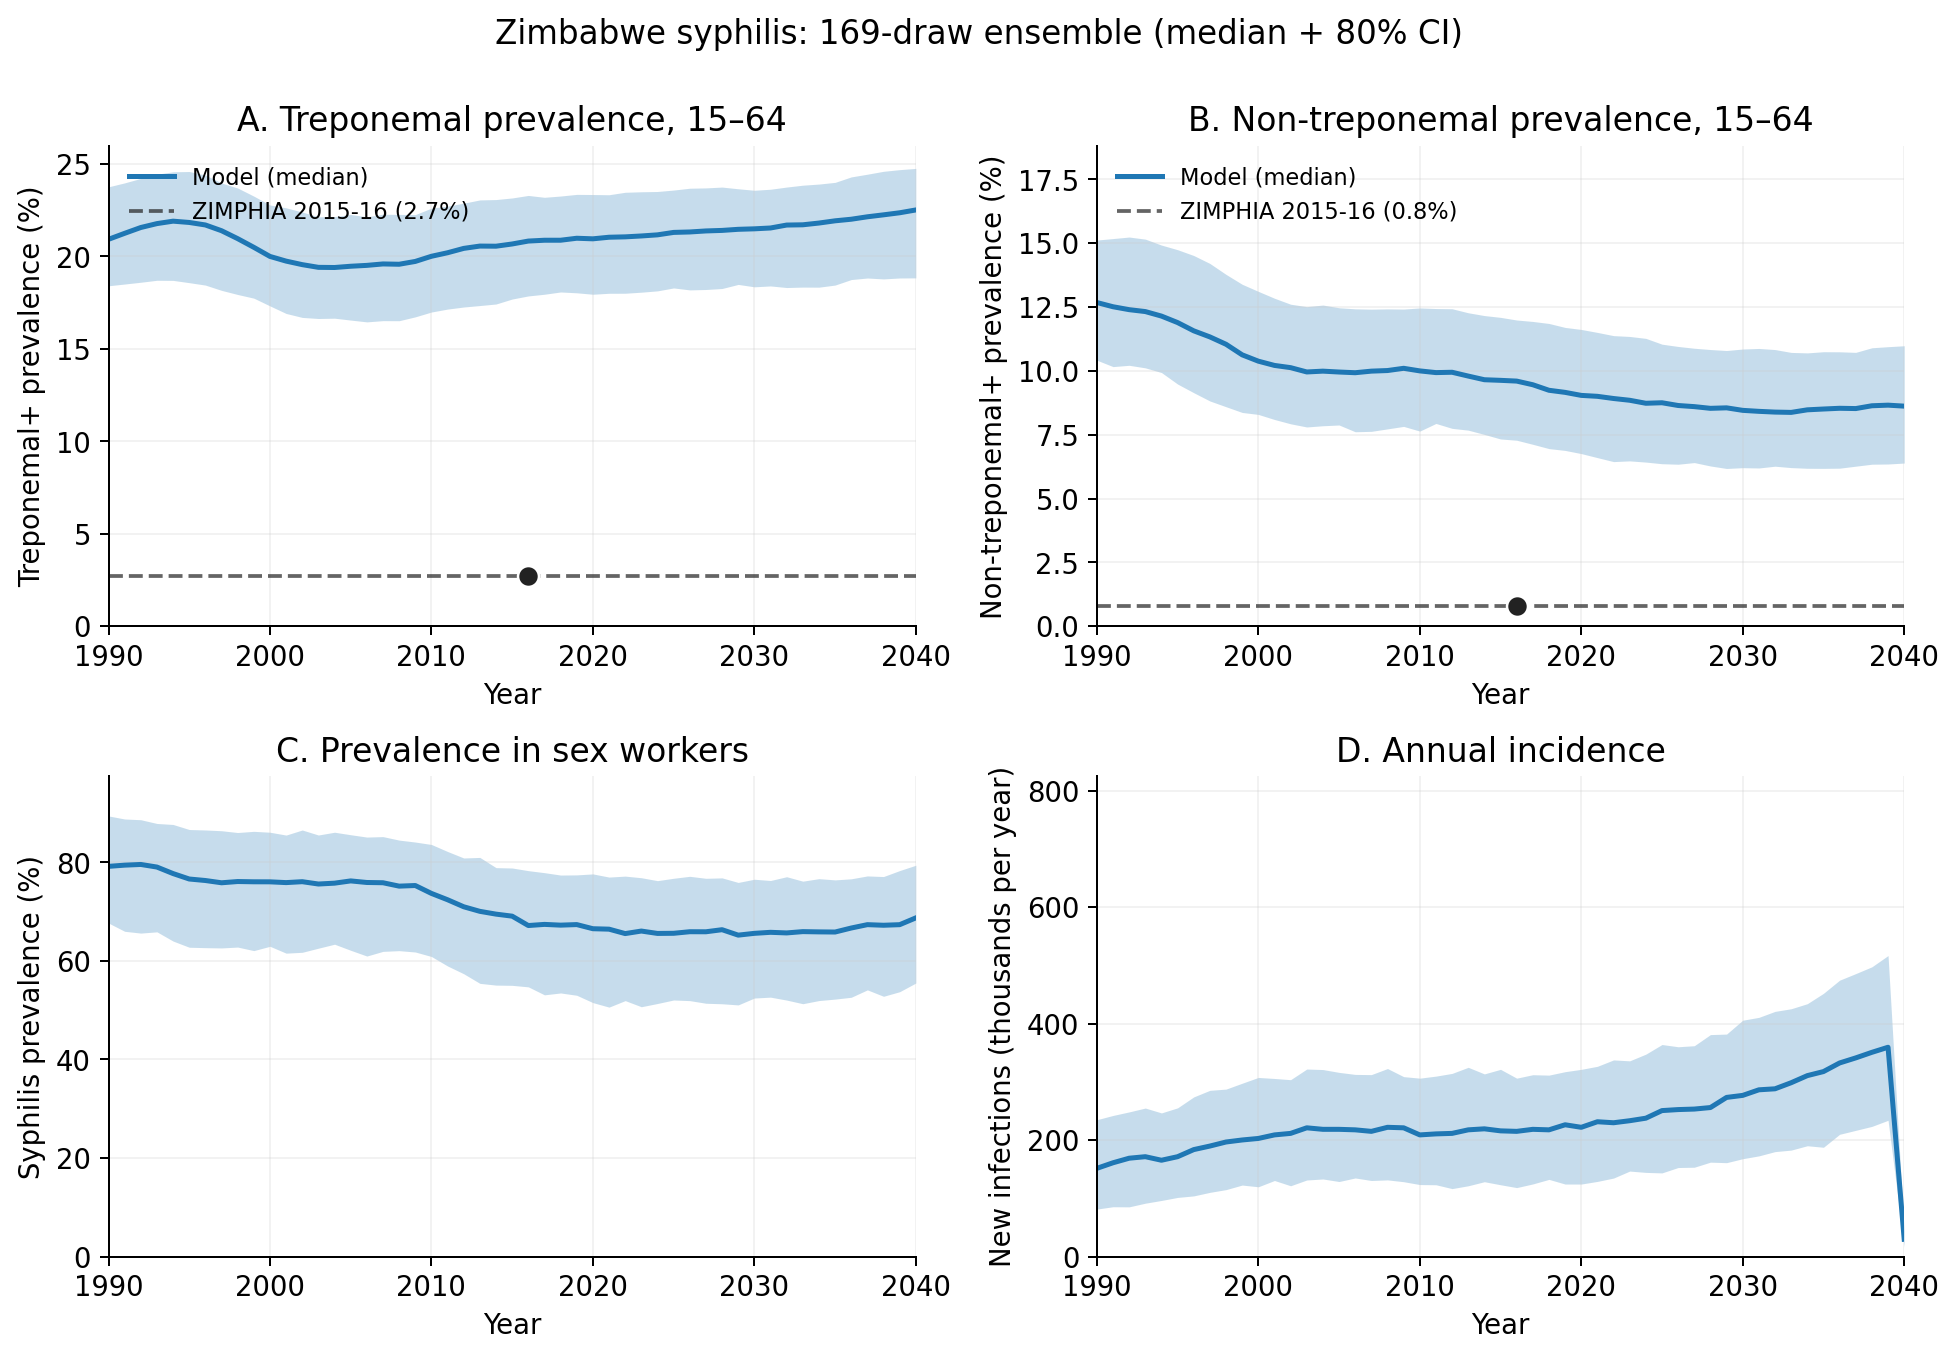
Calibration. 2000-draw Latin hypercube sample over 19 open parameters (disease betas, HIV–syphilis coupling, network structure, syphilis natural history), single-seed filtered on sustainability and target pass count, then re-run at 3 seeds per surviving draw for robustness. The resulting 169-draw posterior ensemble (507 sims total) is used throughout this dashboard — results always reflect that ensemble’s spread, not a single point estimate.
Scenario design. Three intensity ladders (care-seeking, partner-notification, bundled prevention), each with 4 levels, layered on a standard-of-care (SOC) vs point-of-care (POC) diagnostics factorial — 65 cells total (SOC + 4×4×4 POC combinations), each run across the full posterior ensemble. Ladders diverge from SOC-equivalent levels only from the 2027 intervention year onward.