This page is for people who model HIV and other STIs over partnership networks with EpiModel in R: networks estimated by netest() from target statistics, checked with netdx(), and run with netsim() and modules written as R functions. It shows an EpiModel model next to the same model in Starsim, how their results agree, how long each takes, and what works and what does not yet, including what fails.
The same model in both
EpiModel’s introduction: an SIS epidemic among 500 people, over partnerships that form and dissolve. In EpiModel the network is fitted to target statistics (175 partnerships, 110 people with two or more partners, nobody with four or more), and then the epidemic is run over it:
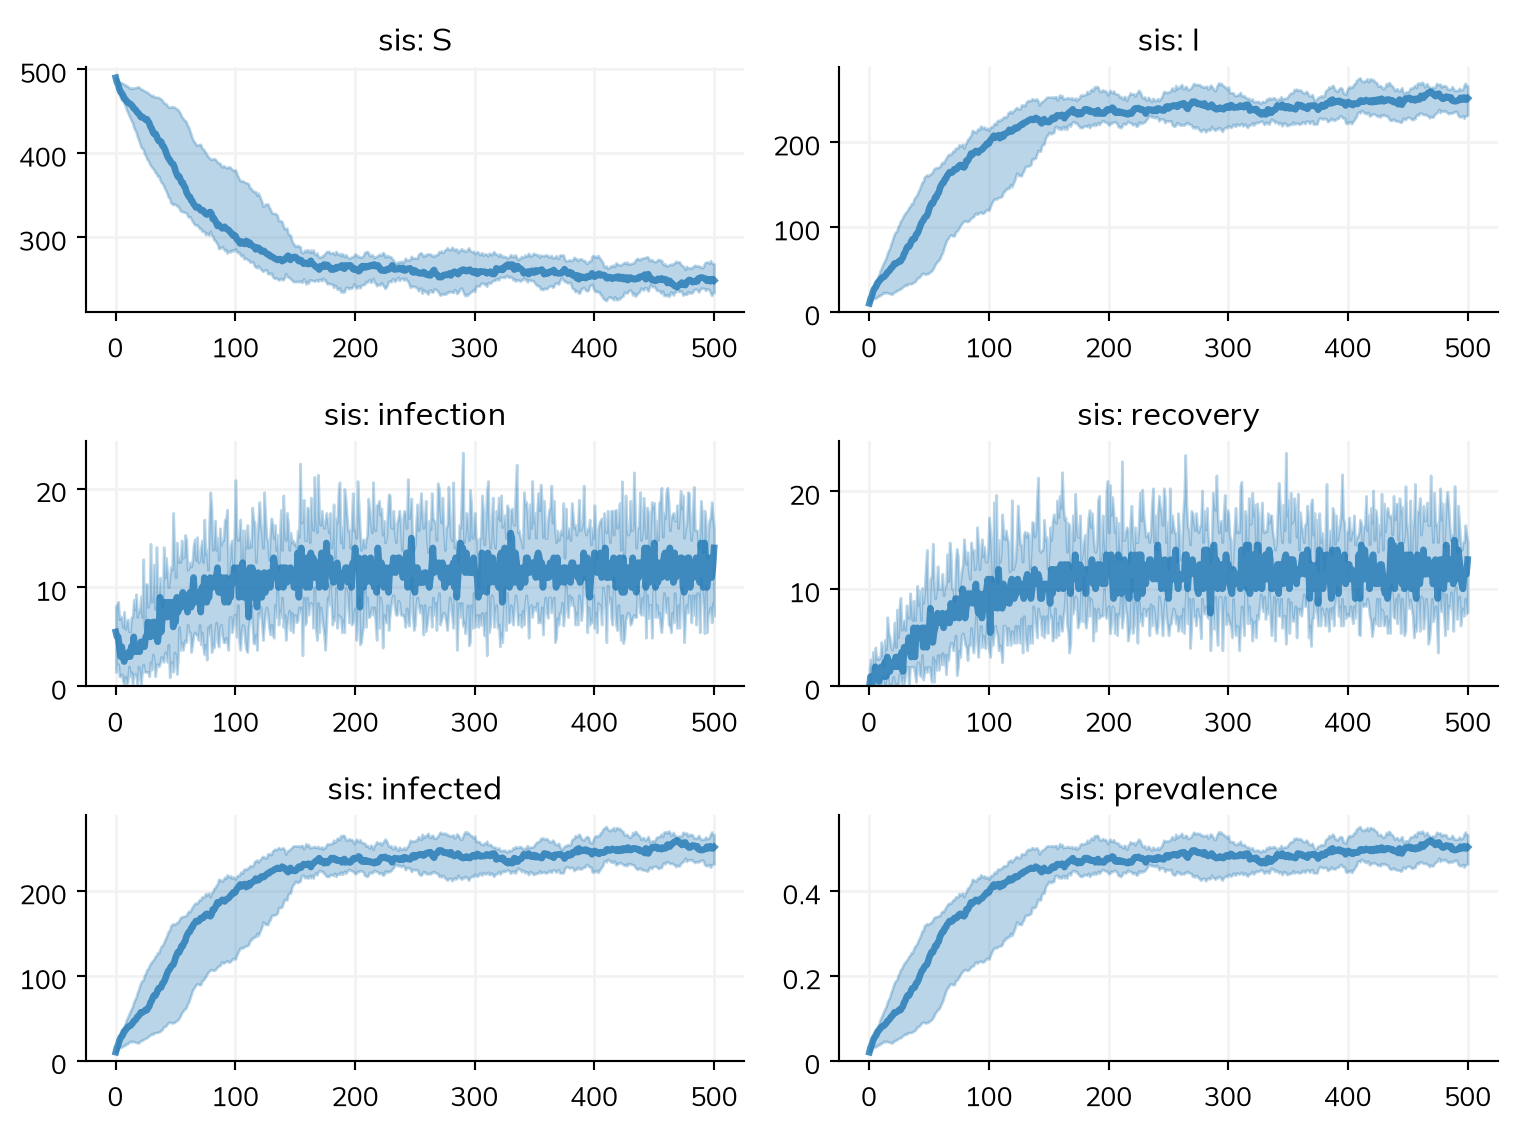
In Starsim, ss.DegreeNet takes the same targets: a mean of 0.7 partners each (175 partnerships among 500 people), 22% with two or more, at most three, lasting 50 steps on average. With acts=ss.freqperday(2) (two acts a step, a day here), the disease’s beta is per act, as EpiModel’s inf.prob:
import starsim as ssS, I = ss.states('S I')sis = ss.Disease(infection= ss.Transition(S, I, rate=ss.prob(0.4) * I), # Per actrecovery= ss.Transition(I, S, rate=ss.prob(0.05)),init_n=dict(I=10),)partners = ss.DegreeNet(n_contacts=0.7, concurrency=0.22, max_contacts=3, dur=50, acts=ss.freqperday(2))sim = ss.Sim(sis, networks=partners, n_agents=500, stop=500, verbose=0)msim = ss.parallel(sim, n_runs=10)mean_I = msim.results.sis.I.mean() # The mean of the runs, at each stepprint('Infected over the last 200 steps, on average:', round(mean_I[-200:].mean()), 'of 500')msim.plot()
Infected over the last 200 steps, on average: 244 of 500
There is no estimation step: people look for partners at a rate that depends on how many they have, chosen so that the targets are the network’s stable state. This is not an ERGM. It matches the number of partners people have (by group, if asked) and the share of partnerships within a group, but not other structure an ERGM can target, such as triangles (gwesp). net.check() compares the realized network with its targets, as netdx() does.
How the results agree
These are from the translations of two EpiModel examples, each run many times and compared with EpiModel 2.6.2’s own runs:
Model
Agreement
The introduction’s SIS (above, as translated with beta per partnership rather than acts=; the version above gives 242 in 10 runs)
Agree once the order within a step is allowed for: 11.8 new infections a step at equilibrium against 12.0, and 115 infected after step 50 against 113 (means of 100 runs each). Over the last 200 steps, 237 of 500 are infected against EpiModel’s 227.5, since EpiModel lets people recover in the step in which they are infected and counts them after that, which makes its count about 5% lower for the same epidemic. The network has 173 partnerships, 109 people with two or more, against EpiModel’s 177 and 111
The Gallery’s HIV model (two networks, acute, chronic, and AIDS stages, a care cascade, PrEP, four scenarios)
Agree within the noise of the runs with the cascade, and with the cascade and PrEP; with PrEP alone, final prevalence is 7.4% against 7.3%. With no intervention, it is 16.4% against 14.4%, about two standard errors. The likely cause is the casual network: Starsim’s meets its targets (a mean degree of 0.30, and 10.2% with two or more casual partners), while EpiModel’s undershoots them (0.28 and 8.9%)
Timings
Lines are lines of model code (not counting blank lines, comments, imports, or plotting, and counting a line over 100 characters twice); times are for one run, the first in a new process and a rerun of the same model. Both were measured as described on the comparison page. EpiModel’s times were recorded with EpiModel 2.6.2 on the same machine, inside one R session.
Model
Lines: EpiModel
Lines: Starsim
One run: EpiModel
One run: Starsim
The introduction’s SIS
13
9
first 6.5 s, rerun 5.4 s, the first with estimating the network (0.66 s)
first 0.54 s, rerun 0.34 s
Pass
The Gallery’s HIV model
405
58
first 48 s, rerun 48 s, the first with estimating the two networks (1.2 s)
first 2.4 s, rerun 2 s
Pass
The SIS scaled to 100,000 people, 200 steps
28 s, plus 233 s to estimate the network
2.9 s
Pass
The last row’s EpiModel times were measured on 17 October 2026 (with tergmLite = TRUE), on a machine shared with other jobs; Starsim’s time is from 18 October 2026. Final prevalence there was 43.3% in EpiModel and 47% in Starsim.
What works and what does not yet
These are from Starsim’s switching demo for EpiModel users (tests/switching/test_epimodel.py in this repo), which checks each task against EpiModel’s numbers, and from the review it was built from. “Fails” means the demo’s check does not pass today.
Task
Today
Degree by risk group, with most partnerships within a group (EpiModel’s nodefactor and nodematch)
Works: n_contacts=ss.by(...) and match=, below. Prevalence by group is within 6 points of EpiModel’s 20.7% and 77.4%
Several match= properties at once
Works: match=dict(risk=0.9, region=0.7), a target for each
A mixing matrix (nodemix), age differences (absdiff), degree in one network conditioning another
Not yet
Triangles and other terms that need an ERGM (gwesp)
Not planned: ss.DegreeNet is not an ERGM
Acts per partnership
Works: acts= on ss.DegreeNet, with beta per act
Partner services: notifying the partners of the past year, not only current ones
Works: memory=ss.months(12) on the network keeps partnerships that have ended, and trace= on a delivery reaches them; 4.45 partners notified per diagnosis against the 4.34 expected for 10-week partnerships (0.85 with current partners only)
Network diagnostics (netdx)
Works: net.check(n_runs=) gives the target, the realized value, and its spread for the mean degree, concurrency, maximum degree, and duration
Fit the transmission probability to observed prevalence with sim.fit()
Works: fresh runs at the fitted value give 29.2% prevalence against the 30% it was fitted to (300 agents, n_trials=40; 27.7% with the default number of trials, where the default method, Optuna, uses one run per trial). method='abc-smc' is available for stochastic models
Build and run a model from R
Works: through reticulate, with ss$Transition(), states named with ss$states(), and name= (the operators >> and @ have no R spelling); R-Starsim’s transition() and disease() wrap this
Scenarios
Works: sim.new(pars=..., interventions=...) makes a copy of the sim with those changed, and ss.parallel({'Baseline': sim, 'PrEP': prep}) runs the scenarios together
Degree by risk group: 80% of people have a mean of 0.4 partners and 20% a mean of 1.6, and 80% of partnerships are within a group (EpiModel’s target statistics of 320 edges, 320 high-risk ends, and 256 within a group):
net = ss.DegreeNet(n_contacts=ss.by(risk=[0.4, 1.6]), match=dict(risk=0.8), dur=50)S, I = ss.states('S I')sis = ss.Disease(infection= ss.Transition(S, I, rate=ss.prob(1-0.6**2) * I), # Two acts at 0.4recovery= ss.Transition(I, S, rate=ss.prob(0.05)),init_n=dict(I=10),)sim = ss.Sim(sis, networks=net, n_agents=1000, stop=300, verbose=0)sim.stratify(risk={'low': 0.8, 'high': 0.2})sim.run()res = sim.results.sisfor risk, epimodel in [('low', 20.7), ('high', 77.4)]: I, S = res.I.select(risk=risk)[150:], res.S.select(risk=risk)[150:] # After a burn-in of 150 stepsprint(f'Prevalence at {risk} risk:', round(100*(I/(I + S)).mean(), 1), "percent, against EpiModel's", epimodel)
Prevalence at low risk: 22.9 percent, against EpiModel's 20.7
Prevalence at high risk: 81.3 percent, against EpiModel's 77.4
Bringing your model in
ss.import_from('model.R', format='epimodel') reads an EpiModel model. Since EpiModel models are R scripts, the script is first run in EpiModel’s own environment by dump_epimodel.R (in starsim/converters/), with EpiModel’s fitting and simulating functions replaced by ones that record their arguments, and that writes a JSON file for ss.import_from(). A model of a built-in type ("SI", "SIS", "SIR") becomes a disease with its transitions, and a network fitted by netest() becomes an ss.DegreeNet with the same targets (degree by group from nodefactor, and act.rate as acts=). Modules written in R (infection.FUN = ...) are listed as not translated, with their source in sim.imported.modules, to be written by hand; sim.imported.prompt is a prompt for an AI assistant with Starsim’s convert-model skill to finish the job. sim.describe() shows how each part was read.
See Import/export for importing in general: checking an import, keeping it as code, and finishing one that is incomplete.
Further reading
EpiModel: website: the package, its papers, and its gallery of models
EpiModel: articles: the vignettes, from basic models to networks and new modules