import numpy as np
from epymorph.kit import *
from epymorph.data.ipm.sirs import SIRS
from epymorph.data.mm.centroids import Centroids
from epymorph.geography.custom import CustomScope
from epymorph.initializer import SingleLocation
from epymorph.rume import SingleStrataRUME
from epymorph.simulator.basic.basic_simulator import BasicSimulator
from epymorph.time import TimeFrame

centroids = np.array([(-100, 40), (-100.5, 40), (-101, 40.5)], dtype=[('longitude', float), ('latitude', float)])
rume = SingleStrataRUME.build(
    ipm = SIRS(),
    mm = Centroids(),
    scope = CustomScope(['a', 'b', 'c']),
    init = SingleLocation(location=0, seed_size=100),
    time_frame = TimeFrame.of('2020-01-01', 120),
    params = dict(beta=0.4, gamma=0.25, xi=0.01, population=np.array([200_000, 100_000, 50_000]),
                  centroid=centroids, phi=40.0, commuter_proportion=0.1),
)
out = BasicSimulator(rume).run(rng_factory=lambda: np.random.default_rng(1))epymorph
This page is for people who use epymorph in Python: metapopulation models that bind a disease model (an IPM), movement (an MM), a geography, and parameters into a RUME. It shows an epymorph model next to the same model in Starsim, how their results agree, and how to bring a model in.
The same model in both
epymorph’s SIRS with its centroids movement, in three places:
In Starsim, the nodes are a stratification by place, and movement is the share of their time that people spend in each other place. The away matrix here is what the importer finds by running the centroids clause: a tenth of people commute, mostly to their own place, for a third of a day. solver='tau' leaps as epymorph does:
import starsim as ss

S, I, R = ss.states('S I R')
sirs = ss.Disease(
    infection = S >> I @ (0.4 * I),
    recovery  = I >> R @ 0.25,
    waning    = R >> S @ 0.01,
    init_n    = dict(I=ss.by([100, 0, 0], dims=['patch'])),
    name      = 'sirs',
)
away = [[0, 0.009995, 0.004021], [0.009295, 0, 0.006078], [0.004379, 0.007259, 0]]
sirs.stratify(patch=ss.levels({'a': 4/7, 'b': 2/7, 'c': 1/7}, mobility=ss.geo.Mobility(matrix=away, kind='commute')))
sim = ss.Sim(sirs, total_pop=350_000, unit='day', start='2020-01-01', stop='2020-04-30', solver='tau', aging=False, verbose=0)
msim = ss.parallel(sim, n_runs=10)
for place, ref in dict(a='16,980 on day 48', b='9,099 on day 54', c='4,488 on day 56').items():
    infectious = msim.results.sirs.I.select(patch=place).mean() # The mean of the 10 runs, at each time
    print(f'Peak infectious in {place}: {infectious.max():,.0f} on day {infectious.values.argmax()} (epymorph, the mean of 20 runs: {ref})')
msim.plot()
Peak infectious in a: 16,836 on day 47 (epymorph, the mean of 20 runs: 16,980 on day 48)
Peak infectious in b: 8,846 on day 53 (epymorph, the mean of 20 runs: 9,099 on day 54)
Peak infectious in c: 4,547 on day 53 (epymorph, the mean of 20 runs: 4,488 on day 56)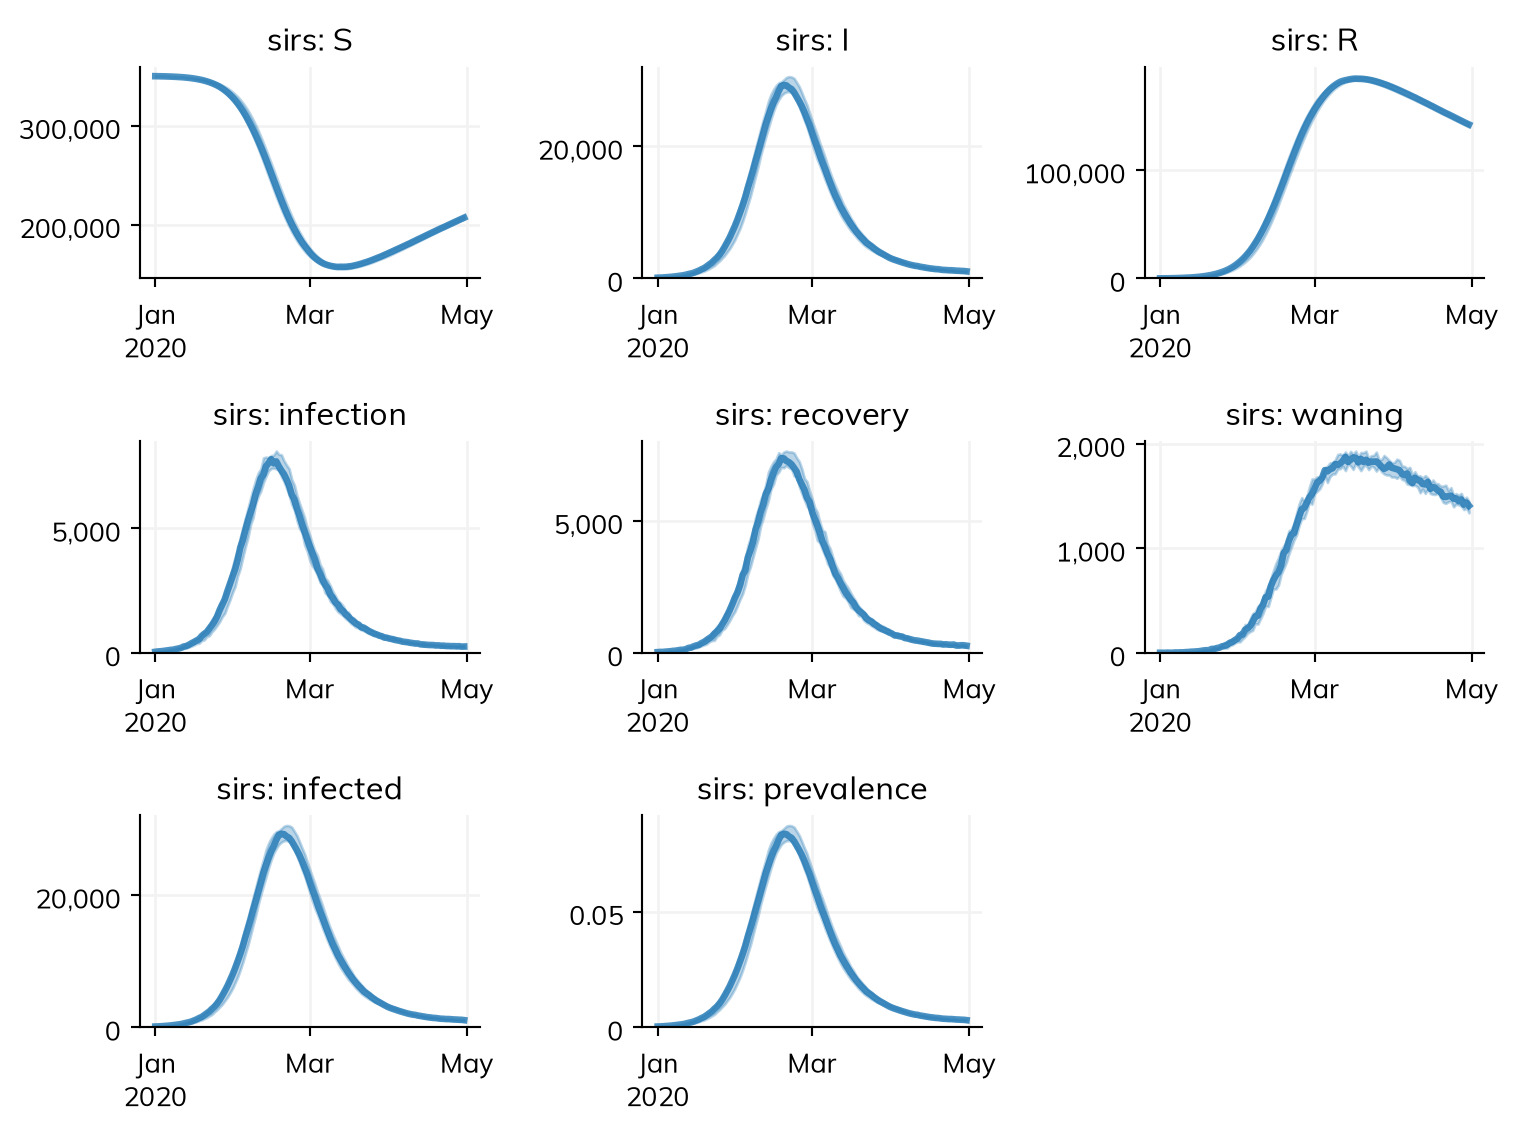
How the results agree
The numbers are from the mean of 10 Starsim runs and 20 runs of epymorph 1.2.0 (10 for the second model).
| Model | Agreement |
|---|---|
| The SIRS above, three places | Agree: peaks in each place within 3%, within three days |
An SIHR with a fork, births and deaths, beta by place, a share in time, and daily commuting, two places |
Agree: peaks within 3% in the seeded place and 8% in the other, within a day |
Bringing your model in
ss.import_from('model.json') reads the JSON written by starsim/converters/epymorph.py run as a script, which runs your script in epymorph’s own environment and needs neither Starsim nor Sciris:
python epymorph.py my_model.py model.json             # A script that makes a variable called rume
python epymorph.py my_model.py:build_rume model.json  # Or a function that returns the RUME
sim = ss.import_from('model.json') # The format is told from the fileThe parameters and initial numbers are read after epymorph resolves them, so values from an ADRIO or a parameter function arrive as numbers, and it doesn’t matter where they came from. Four things to check after importing:
- Movement is averaged. Clauses are Python, so they are run for the first four weeks, and the people they move are averaged into commuting. Time of day and day of the week are averaged out, as are changes in movement after the first four weeks.
- Movement that doesn’t return (a clause with
returns=NEVER), and compartments taggedimmobile, are listed insim.imported.incomplete. - A parameter by place and in time is taken at each place’s mean, and listed.
- The solver. A chain binomial gives peaks far too high at epymorph’s steps of a third of a day or more, because its results depend strongly on the step; use
solver='tau'(the default) or'ode', not'binomial', unless with many substeps.
A RUME with several strata (a MultiStrataRUME) is refused: each stratum divides by its own people, and exposure of that kind does not move between places here, so in a test it did not spread between places at all. The same applies to one edge whose rate divides by only some of the people, which is listed; check it if the model has movement.
See Import/export for importing in general: checking an import, keeping it as code, and finishing one that is incomplete.
Further reading
- epymorph: documentation: the disease, movement, and data parts of a RUME
- epymorph: repository: the code and its examples