This page is for people who use flepiMoP, usually for the Scenario Modeling Hubs: a YAML configuration of compartments, places with their populations and commuting, modifiers for NPIs and vaccination, outcomes chained from the flows, and inference that fits each place’s modifiers to its data, ending in a hub submission of quantiles by scenario, location, target, and week. It shows a flepiMoP configuration next to the same model in Starsim, how their results agree, how long each takes, and what works and what does not yet, including what fails.
The same model in both
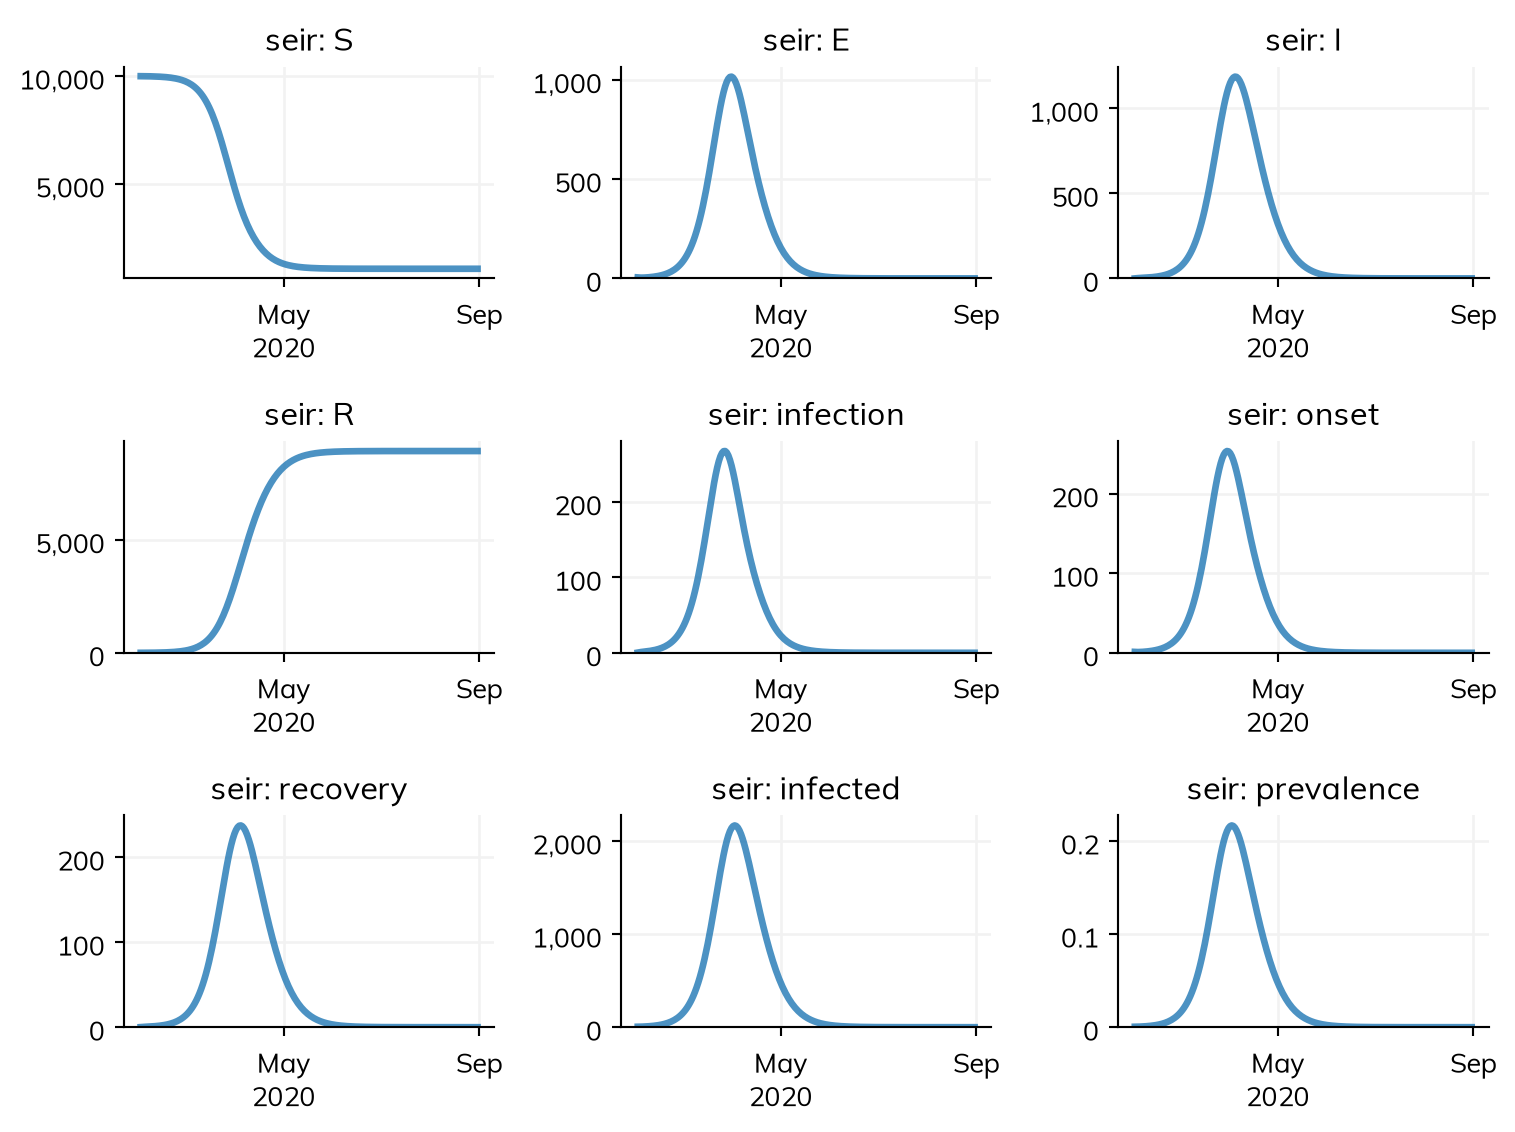
flepiMoP’s two-population tutorial: an SEIR in a large and a small province, whose residents spend part of each day in the other:
with three CSV files: the populations (9,000 and 1,000), the commuters (100 from the large province to the small, 20 the other way), and 5 exposed people in the large province at the start. In Starsim, the places are a stratification with commuting. flepiMoP’s travelers are infected where they go but infect nobody there, which is kind='visit':
import numpy as npimport starsim as sspop =dict(large_province=9000, small_province=1000)commute = [[0, 100/9000], [20/1000, 0]] # The share of each province's residents who travel to the othergamma =1/5S, E, I, R = ss.states('S E I R')seir = ss.Disease(infection= ss.Transition(S, E, rate=2.5*gamma * I),onset= ss.Transition(E, I, rate=1/4),recovery= ss.Transition(I, R, rate=gamma),init_n=dict(E=ss.by(patch=[5, 0])),)away = [[0.5*share for share in row] for row in commute] # Travelers are away for half the dayseir.stratify(patch=ss.levels(pop, mobility=ss.geo.Mobility(matrix=away, kind='visit')))sim = ss.Sim(seir, total_pop=sum(pop.values()), start='2020-02-01', stop='2020-08-31', verbose=0)sim.run()sim.plot()
Or the configuration can be imported as it is, with the CSV files next to it:
Agree: every compartment in both provinces within 0.05 people
The vaccine scenarios tutorial (vaccination, three scenarios of stacked modifiers, Ro and the share of cases detected drawn for each run, outcomes chained with delays)
Agree exactly, by province: run with the values flepiMoP drew, the mean, 5%, and 95% of all 28 series in each province agree within 1e-9 of their largest value in all three scenarios. With Starsim’s own draws, they agree in distribution
A configuration with 3,000 places and 29,958 commuting links, imported with ss.import_from()
Agree: incident cases, hospitalizations, deaths, and current hospitalizations within 0.007% of each place’s peak on every day
Timings
Lines are lines of model code (not counting blank lines, comments, imports, or plotting, and counting a line over 100 characters twice), against the lines of flepiMoP’s YAML; times are for one run, the first in a new process and a rerun of the same model. Both were measured as described on the comparison page. flepiMoP’s times were recorded on the same machine, as a whole command (flepimop simulate), most of which is compiling its integrator with Numba, which it does on every run.
Model
Lines: flepiMoP
Lines: Starsim
One run: flepiMoP
One run: Starsim
The two-population tutorial
42, plus 10 lines of CSV
16
first 8.6 s, rerun 8.8 s as a command
first 0.018 s, rerun 0.00045 s
Pass
The vaccine scenarios tutorial, 30 runs (3 scenarios of 10)
141, plus 10 lines of CSV
33
first 23 s, rerun 23 s as a command
first 0.84 s, rerun 0.55 s
Pass
The 3,000-place configuration, one SEIR run with its outcomes
34 s (58 s the first time, with compiling), plus 6 to 9 s for the outcomes
5.0 s, plus 1.7 s to read the configuration
The last row was measured on 17 October 2026, on a machine shared with other jobs.
What works and what does not yet
These are from Starsim’s switching demo for flepiMoP users (tests/switching/test_flepimop.py in this repo), which checks each task on a configuration of three counties, and from the review it was built from. All three of the demo’s checks pass today.
Task
Today
Import a configuration and run it as an ODE by place
Works, with a list of anything not translated. A parameter drawn from a distribution (distribution: truncnorm) is imported with that distribution as its prior
Fit one value per place: Ro by county, fitted to weekly hospitalizations by county with a Poisson likelihood
Works: sim.new(pars=dict(Ro=ss.par(ss.by(subpop=[2.2, 2.2, 2.2]), bounds=[1, 4]))) and fit(); the fitted values are within 5% of the true ones. Data by place are a long table with a subpop column
A Poisson likelihood on data that are not whole numbers (an ODE’s output)
Works: the likelihood is finite
Runs that each draw their parameters from their priors
Works: ss.parallel(sim, n_runs=, priors=True)
A hub submission (hubverse columns): 23 quantiles or the runs themselves, by scenario, location, target, and week; incident, cumulative, and peak targets
Works: sim.imported.scenarios gives each scenario’s modifiers, as ss.modify interventions
Fits by NUTS with gradients through the run
Works: on flepiMoP’s California and New York benchmark (four parameters, a value for each state in two periods, fitted to six weekly series), NUTS took 70 s on 4 cores against 283 s for flepiMoP’s emcee run on 10 cores, with estimates within 1.5% of the truth (measured on 17 October 2026, with each state’s values written into the rate)
Batch jobs on a cluster, R post-processing
Not planned: Starsim runs in one process on many cores
Runs with Ro drawn from a truncated normal, written as a hub submission (a long table with the columns the hubs ask for):
Ro = ss.par(2.5, prior=ss.truncnorm(mean=2.5, std=0.2, low=2.0, high=3.0))S, E, I, R = ss.states('S E I R')seir = ss.Disease(infection= ss.Transition(S, E, rate=Ro*gamma * I),onset= ss.Transition(E, I, rate=1/4),recovery= ss.Transition(I, R, rate=gamma),init_n=dict(E=ss.by(patch=[5, 0])),)seir.stratify(patch=ss.levels(pop, mobility=ss.geo.Mobility(matrix=away, kind='visit')))sim = ss.Sim(seir, total_pop=sum(pop.values()), start='2020-02-01', stop='2020-08-31', verbose=0)msim = ss.parallel(sim, n_runs=20, priors=True) # Each run draws its own Rohub = ss.converters.to_hub(msim, targets=dict(infection='inc inf'), by='patch', every='week')hub.head()
origin_date
scenario_id
location
target
horizon
output_type
output_type_id
value
0
2020-02-01
large_province
inc inf
1
quantile
0.01
8.339158
1
2020-02-01
large_province
inc inf
2
quantile
0.01
18.628803
2
2020-02-01
large_province
inc inf
3
quantile
0.01
37.786574
3
2020-02-01
large_province
inc inf
4
quantile
0.01
76.008290
4
2020-02-01
large_province
inc inf
5
quantile
0.01
150.568296
Bringing your model in
ss.import_from('config.yml', format='flepimop') reads a flepiMoP configuration. The compartments become states (with several dimensions, one state for each combination, named as flepiMoP names them, e.g. S_unvaccinated); the places become a stratification subpop with commuting (ss.geo.Mobility(kind='visit')); each transition becomes a flow; the modifiers of a scenario become ss.modify interventions; and the outcomes become ss.outcomes. A configuration with age, vaccination, and variant as dimensions comes in as a flat product of states, which runs the same as flepiMoP but is not how it would be written in Starsim, where each dimension is a stratification. What is not translated is listed (sim.imported.incomplete), and sim.imported.prompt is a prompt for an AI assistant with Starsim’s convert-model skill to finish the job.
See Import/export for importing in general: checking an import, keeping it as code, and finishing one that is incomplete.