import numpy as np
from memilio.simulation import ContactMatrix, Damping, AgeGroup
from memilio.simulation.osecir import InfectionState as State
from memilio.simulation.osecir import Model, simulate

model = Model(3)

t0 = 0
tmax = 50
dt = 0.1

cont_freq = 10
nb_total_t0, nb_exp_t0, nb_inf_t0, nb_car_t0, nb_hosp_t0, nb_icu_t0, nb_rec_t0, nb_dead_t0 = 10000, 100, 50, 50, 20, 10, 10, 0

nb_comp = 10
nb_groups = 3
fact = 1.0/nb_groups

model.parameters.StartDay = 60
model.parameters.Seasonality.value = 0.2
model.parameters.TestAndTraceCapacity.value = 35

for i in range(0, 3):
    Ai = AgeGroup(i)

    model.parameters.TimeExposed[Ai] = 3.2
    model.parameters.TimeInfectedNoSymptoms[Ai] = 2.0
    model.parameters.TimeInfectedSymptoms[Ai] = 5.8
    model.parameters.TimeInfectedSevere[Ai] = 9.5
    model.parameters.TimeInfectedCritical[Ai] = 7.1

    model.populations[Ai, State.Exposed] = fact * nb_exp_t0
    model.populations[Ai, State.InfectedNoSymptoms] = fact * nb_car_t0
    model.populations[Ai, State.InfectedSymptoms] = fact * nb_inf_t0
    model.populations[Ai, State.InfectedSevere] = fact * nb_hosp_t0
    model.populations[Ai, State.InfectedCritical] = fact * nb_icu_t0
    model.populations[Ai, State.Recovered] = fact * nb_rec_t0
    model.populations[Ai, State.Dead] = fact * nb_dead_t0
    model.populations.set_difference_from_group_total_AgeGroup(
        (Ai, State.Susceptible), fact * nb_total_t0)

    model.parameters.TransmissionProbabilityOnContact[Ai] = 0.05
    model.parameters.RelativeTransmissionNoSymptoms[Ai] = 0.7
    model.parameters.RecoveredPerInfectedNoSymptoms[Ai] = 0.09
    model.parameters.RiskOfInfectionFromSymptomatic[Ai] = 0.25
    model.parameters.MaxRiskOfInfectionFromSymptomatic[Ai] = 0.45
    model.parameters.SeverePerInfectedSymptoms[Ai] = 0.2
    model.parameters.CriticalPerSevere[Ai] = 0.25
    model.parameters.DeathsPerCritical[Ai] = 0.3

model.apply_constraints()

contacts = ContactMatrix(
    np.full((nb_groups, nb_groups), fact * cont_freq))
contacts.add_damping(
    Damping(coeffs=np.full((nb_groups, nb_groups), 0.7), t=30.0, level=0, type=0))
model.parameters.ContactPatterns.cont_freq_mat[0] = contacts

result = simulate(t0=t0, tmax=tmax, dt=dt, model=model)MEmilio
This page is for people who use MEmilio’s ODE models (osecir, osecirvvs) from Python: the age-resolved SECIR on a graph of counties with commuting, contact matrices with dampings, dynamic NPIs that switch on by county, and parameter studies with percentiles by county. It shows a MEmilio model next to the same model in Starsim, how their results agree, how long each takes, and what works and what does not yet, including what fails.
The same model in both
MEmilio’s age-resolved SECIR example: three age groups, seasonality, a 70% cut in contacts on day 30, and symptomatic people who infect more once testing and tracing are overwhelmed. In MEmilio the equations are in C++ (cpp/models/ode_secir/model.h), and the script sets their parameters. The part of the script that builds and runs the model (the rest plots the results):
In Starsim the equations are in the script: each of MEmilio’s flows is a transition, its branches are a dict of destinations ({R: None, H: 0.1}), the damping is a time series smoothed over the day before (as MEmilio smooths it), and the test-and-trace capacity is a function of the number becoming symptomatic:
import numpy as np
import starsim as ss

beta     = ss.seasonal(mean=0.05, amplitude=0.2, peak=ss.days(-60)) # Highest on 1 Jan; day 0 is 2 Mar
contacts = ss.timeseries({0: 1.0, 29: 1.0, 30: 0.3}, interpolation='cosine') # Cut by 70% over day 29, as MEmilio's damping
S, E, INS, ISy, ISev, ICr, R = ss.states(7)
excess = np.clip((0.91/2*INS.n - 35)/(5*35 - 35), 0, 1) # People becoming symptomatic each day, beyond the 35 that can be traced (to 5 times that)
risk = 0.35 - 0.1*np.cos(np.pi*excess) # So symptomatic people infect more: from 0.25 to 0.45, along half a cosine

secir = ss.Disease(
    infection = S >> E @ beta * contacts * (0.7 * INS + risk * ISy),
    onset     = E >> INS @ ss.days(3.2),
    symptoms  = ss.Transition(INS, {ISy: 0.91, R: 0.09}, dur=ss.days(2)),
    severe    = ss.Transition(ISy, {ISev: 0.2, R: 0.8}, dur=ss.days(5.8)),
    critical  = ss.Transition(ISev, {ICr: 0.25, R: 0.75}, dur=ss.days(9.5)),
    recovery  = ss.Transition(ICr, R, dur=ss.days(7.1), p=0.7),
    death     = ss.Transition(ICr, ss.dead, dur=ss.days(7.1), p=0.3),
    init_n    = dict(E=100, INS=50, ISy=50, ISev=20, ICr=10, R=10),
)
secir.stratify(age=['0', '1', '2']) # Three groups of equal size, each with a third of every state
mixing = ss.contacts(np.full((3, 3), 10/3)) # 10 contacts a day, spread evenly over the groups
sim = ss.Sim(secir, networks=mixing, total_pop=10_000, stop=ss.days(50), verbose=0)
sim.run()
sim.plot()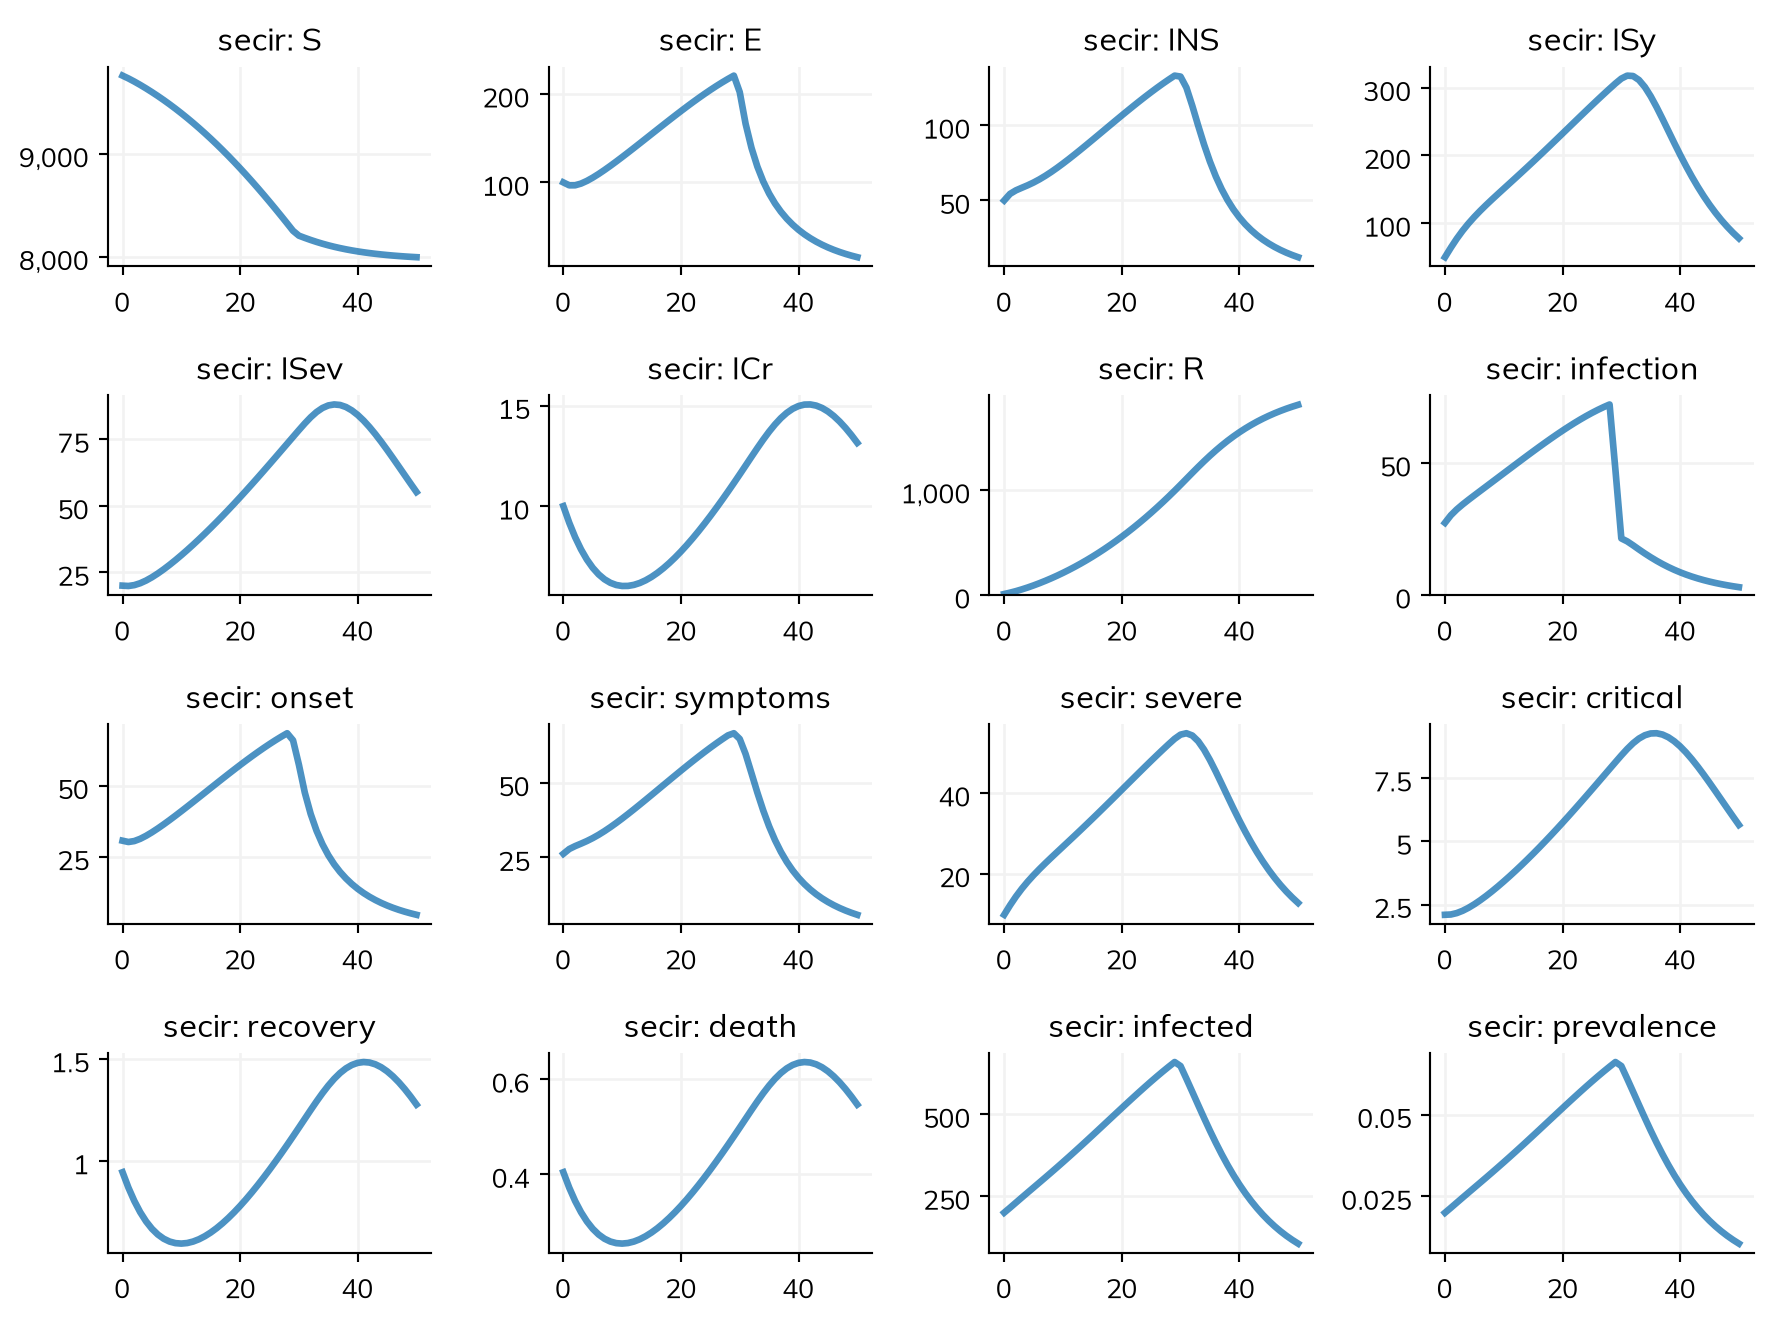
The same declaration runs as a stochastic compartmental model or as agents with solver='binomial' or solver='abm'; MEmilio does these with separate codebases. Erlang stages (MEmilio’s LCT models) are stages= on a transition.
How the results agree
| Model | Agreement |
|---|---|
| The age-resolved SECIR (above) | Agree: within 1.5 people of 10,000 at every time, which is the error of MEmilio’s own output (interpolated between its solver’s steps); deaths within 0.02 |
| The SECIR without age groups | Agree: within 73 people of 83,000 at every time, the interpolation error of the reference; deaths within 0.5 |
The SECIR in 6 age groups and 50 counties, with commuting (MEmilio’s MobilityGraph) |
Agree in total: the national peak of symptomatic people is within 0.2% of MEmilio’s (0.8% at 400 counties). County by county, the difference is larger (a median of 11% of a county’s peak, in counties where the epidemic is started by commuters): MEmilio moves commuters into the destination county for half of each day, while Starsim weights exposure by the share of time away. Without commuting, the counties agree to 1e-8 |
Timings
Lines are lines of model code (not counting blank lines, comments, imports, or plotting, and counting a line over 100 characters twice); times are for one run, the first in a new process and a rerun of the same model. Both were measured as described on the comparison page. MEmilio 2.4.1’s times were recorded on the same machine, in process, not counting starting Python or importing; a rerun is simulate() again on the same model. Both are in solvers built in advance in C++.
| Model | Lines: MEmilio | Lines: Starsim | One run: MEmilio | One run: Starsim | |
|---|---|---|---|---|---|
| The SECIR | 44 | 14 | first 0.00045 s, rerun 0.00002 s | first 0.014 s, rerun 0.00043 s | Pass |
| The age-resolved SECIR (above) | 45 | 22 | first 0.00082 s, rerun 0.00006 s | first 0.02 s, rerun 0.00056 s | Pass |
| 50 counties × 6 ages with commuting, 90 days | 0.17 s | 0.1 s | |||
| 400 counties × 6 ages with commuting, 90 days | 1.54 s to run, 13.4 s to build the graph in Python | 0.7 s |
The last two rows are the switching demo’s synthetic Germany (lognormal county populations summing to 83 million, gravity commuting to each county’s 20 nearest neighbors). MEmilio’s times were measured on 17 October 2026 and Starsim’s on 18 October 2026.
What works and what does not yet
These are from Starsim’s switching demo for MEmilio users (tests/switching/test_memilio.py in this repo), which checks each task against MEmilio’s numbers, and from the review it was built from. All four of the demo’s checks pass today.
| Task | Today |
|---|---|
Counties by age with commuting (ss.geo.Mobility(matrix=..., kind='commute')) |
Works: national peak within 0.2% of MEmilio’s at 50 counties |
| Speed at 400 counties × 6 ages | Works: 0.7 s against MEmilio’s 1.54 s, with the time growing about in proportion to the number of counties |
| Dynamic NPIs by county: a county whose 7-day incidence passes 200 per 100,000 gets its own damping for at least 14 days | Works: incidence = secir.symptoms.incidence(over=ss.days(7), by='patch') and ss.modify(beta, multiply=0.6, who=incidence > 200e-5, until=ss.days(14)); the peak falls to 20% of the peak without NPIs, as with a rule written by hand. This is run from Python each step, so the run is taken a step at a time rather than in one call to compiled code |
| A parameter study: each run draws its parameters from their distributions, with percentiles by county | Works: ss.par(1.0, prior=ss.uniform(0.75, 1.25)), ss.parallel(sim, n_runs=10, priors=True), and msim.results.secir.ISy.select(patch='c005').quantiles([0.05, 0.25, 0.5, 0.75, 0.95]) |
Import a graph (MobilityGraph) or a GraphParameterStudy |
Works (see below) |
Import an osecirvvs model |
Not yet |
| Commuters with symptoms commuting less, as MEmilio has them | Not yet: ss.geo.Mobility cannot say it, and this is most of the county-by-county difference above |
German counties by name, with Destatis populations and the commuter matrix (ss.geo.geography('Germany', level=2)) |
Not yet: Starsim’s data have no German level-2 populations or commuting |
| A posterior: NUTS on the ODE with gradients, or particle MCMC on a stochastic model | Works, with sim.fit(method='nuts') or method='pmcmc'; MEmilio has no fitting of its own |
Bringing your model in
ss.import_from('model.json', format='memilio') reads a MEmilio ODE model. Since a MEmilio script only sets the parameters of a model built in C++, the script is first run in MEmilio’s own environment by starsim/converters/memilio.py (run as a script), which records the model it simulates and writes a JSON file. The equations of the supported models (osir, oseir, oseirdb, and osecir) are written in Starsim as MEmilio’s C++ has them; the parameters, the initial populations by age group, and the contact matrices with their dampings come from the file. A graph (MobilityGraph, or the graph of a GraphParameterStudy) becomes a stratification by place with its edges as commuting, and the distributions of a parameter study become the parameters’ priors, for ss.parallel(sim, n_runs=, priors=True). What is not translated is listed (sim.imported.incomplete), and sim.imported.prompt is a prompt for an AI assistant with Starsim’s convert-model skill to finish the job.
See Import/export for importing in general: checking an import, keeping it as code, and finishing one that is incomplete.
Further reading
- MEmilio: documentation: the models (ODE, IDE, metapopulation, and agent-based) and their Python interface
- MEmilio: repository: the code, with its examples in C++ and Python