import tbsim
import starsim as ss
import matplotlib.pyplot as pltComprehensive Analyzer Plots Example
This notebook demonstrates all available plotting methods in the DwtAnalyzer class from the tbsim package. It is adapted from the original Python script for interactive exploration.
Build a TB simulation with dwell time analyzer
def build_tbsim(sim_pars=None):
    sim_params = dict(
        start = ss.date('2013-01-01'),
        stop = ss.date('2016-12-31'),
        rand_seed=123,
        dt=ss.days(7),
    )
    if sim_pars is not None:
        sim_params.update(sim_pars)
    pop = ss.People(n_agents=1000)
    tb_params = dict(
        beta=ss.peryear(0.025),
        init_prev=ss.bernoulli(p=0.25),
    )
    tb = tbsim.TB(tb_params)
    net = ss.RandomNet(dict(n_contacts=ss.poisson(lam=5), dur=0))
    dwell_analyzer = tbsim.DwtAnalyzer(scenario_name='comprehensive_plots_example')
    sim = ss.Sim(
        people=pop,
        networks=net,
        diseases=tb,
        pars=sim_params,
        analyzers=dwell_analyzer,
    )
    sim.pars.verbose = 0
    return sim
Run the simulation and extract the analyzer
print("Building and running TB simulation...")
sim_tb = build_tbsim()
sim_tb.run()
analyzer = sim_tb.analyzers[0]
Building and running TB simulation.../home/runner/work/tbsim/tbsim/tbsim/analyzers.py:419: FutureWarning: The behavior of DataFrame concatenation with empty or all-NA entries is deprecated. In a future version, this will no longer exclude empty or all-NA columns when determining the result dtypes. To retain the old behavior, exclude the relevant entries before the concat operation.
self._latest_sts_df = pd.concat(
/home/runner/work/tbsim/tbsim/tbsim/analyzers.py:471: FutureWarning: The behavior of DataFrame concatenation with empty or all-NA entries is deprecated. In a future version, this will no longer exclude empty or all-NA columns when determining the result dtypes. To retain the old behavior, exclude the relevant entries before the concat operation.
self.data = pd.concat([self.data, new_logs], ignore_index=True)1. Network Graph
Directed graph of state transitions.
analyzer.plot('network')<Figure size 1440x960 with 0 Axes>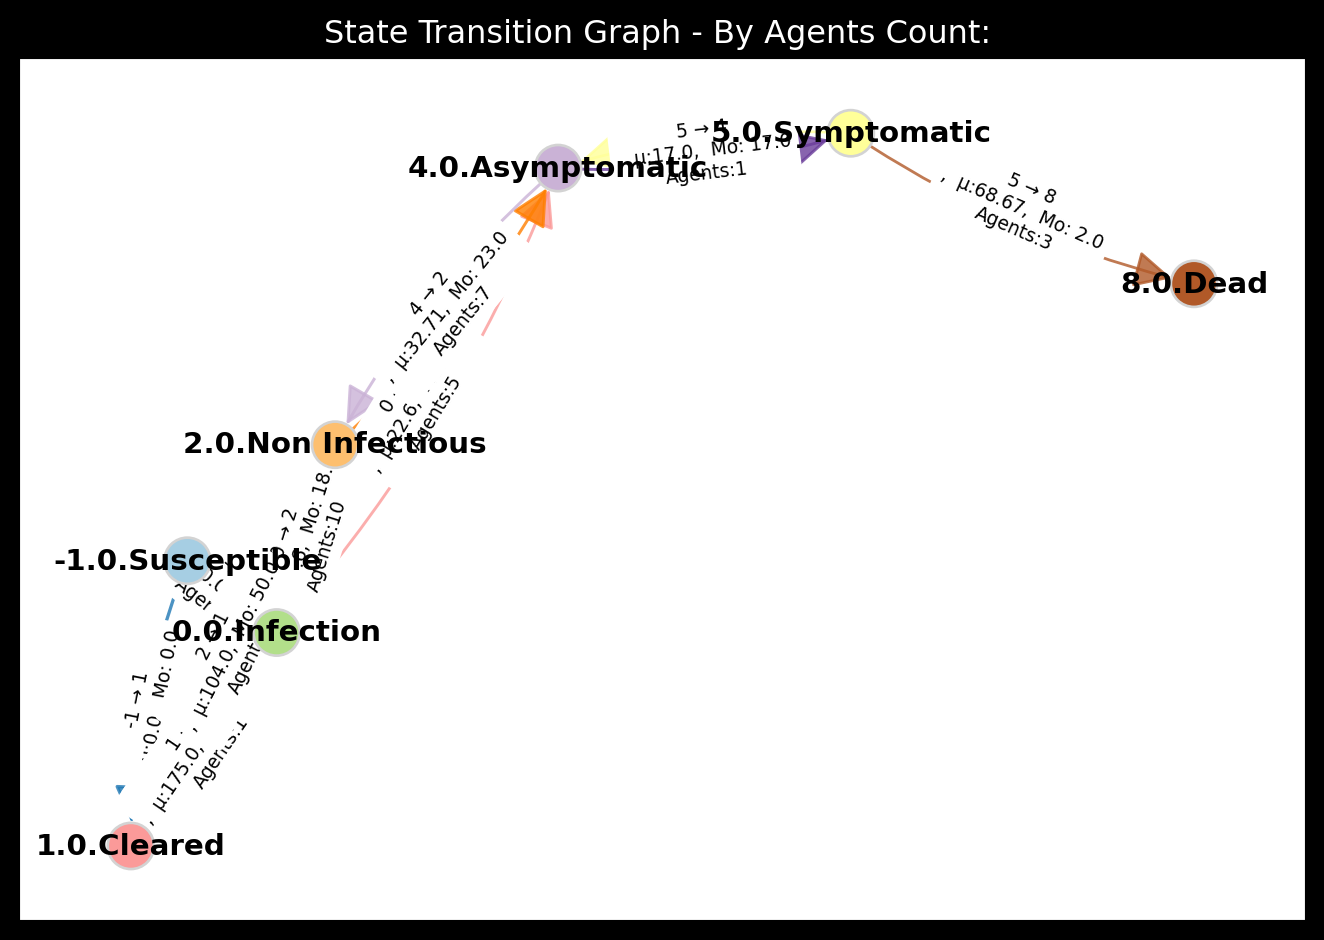
2. Histograms
Histograms with KDE of dwell time distributions per state.
analyzer.plot('histogram')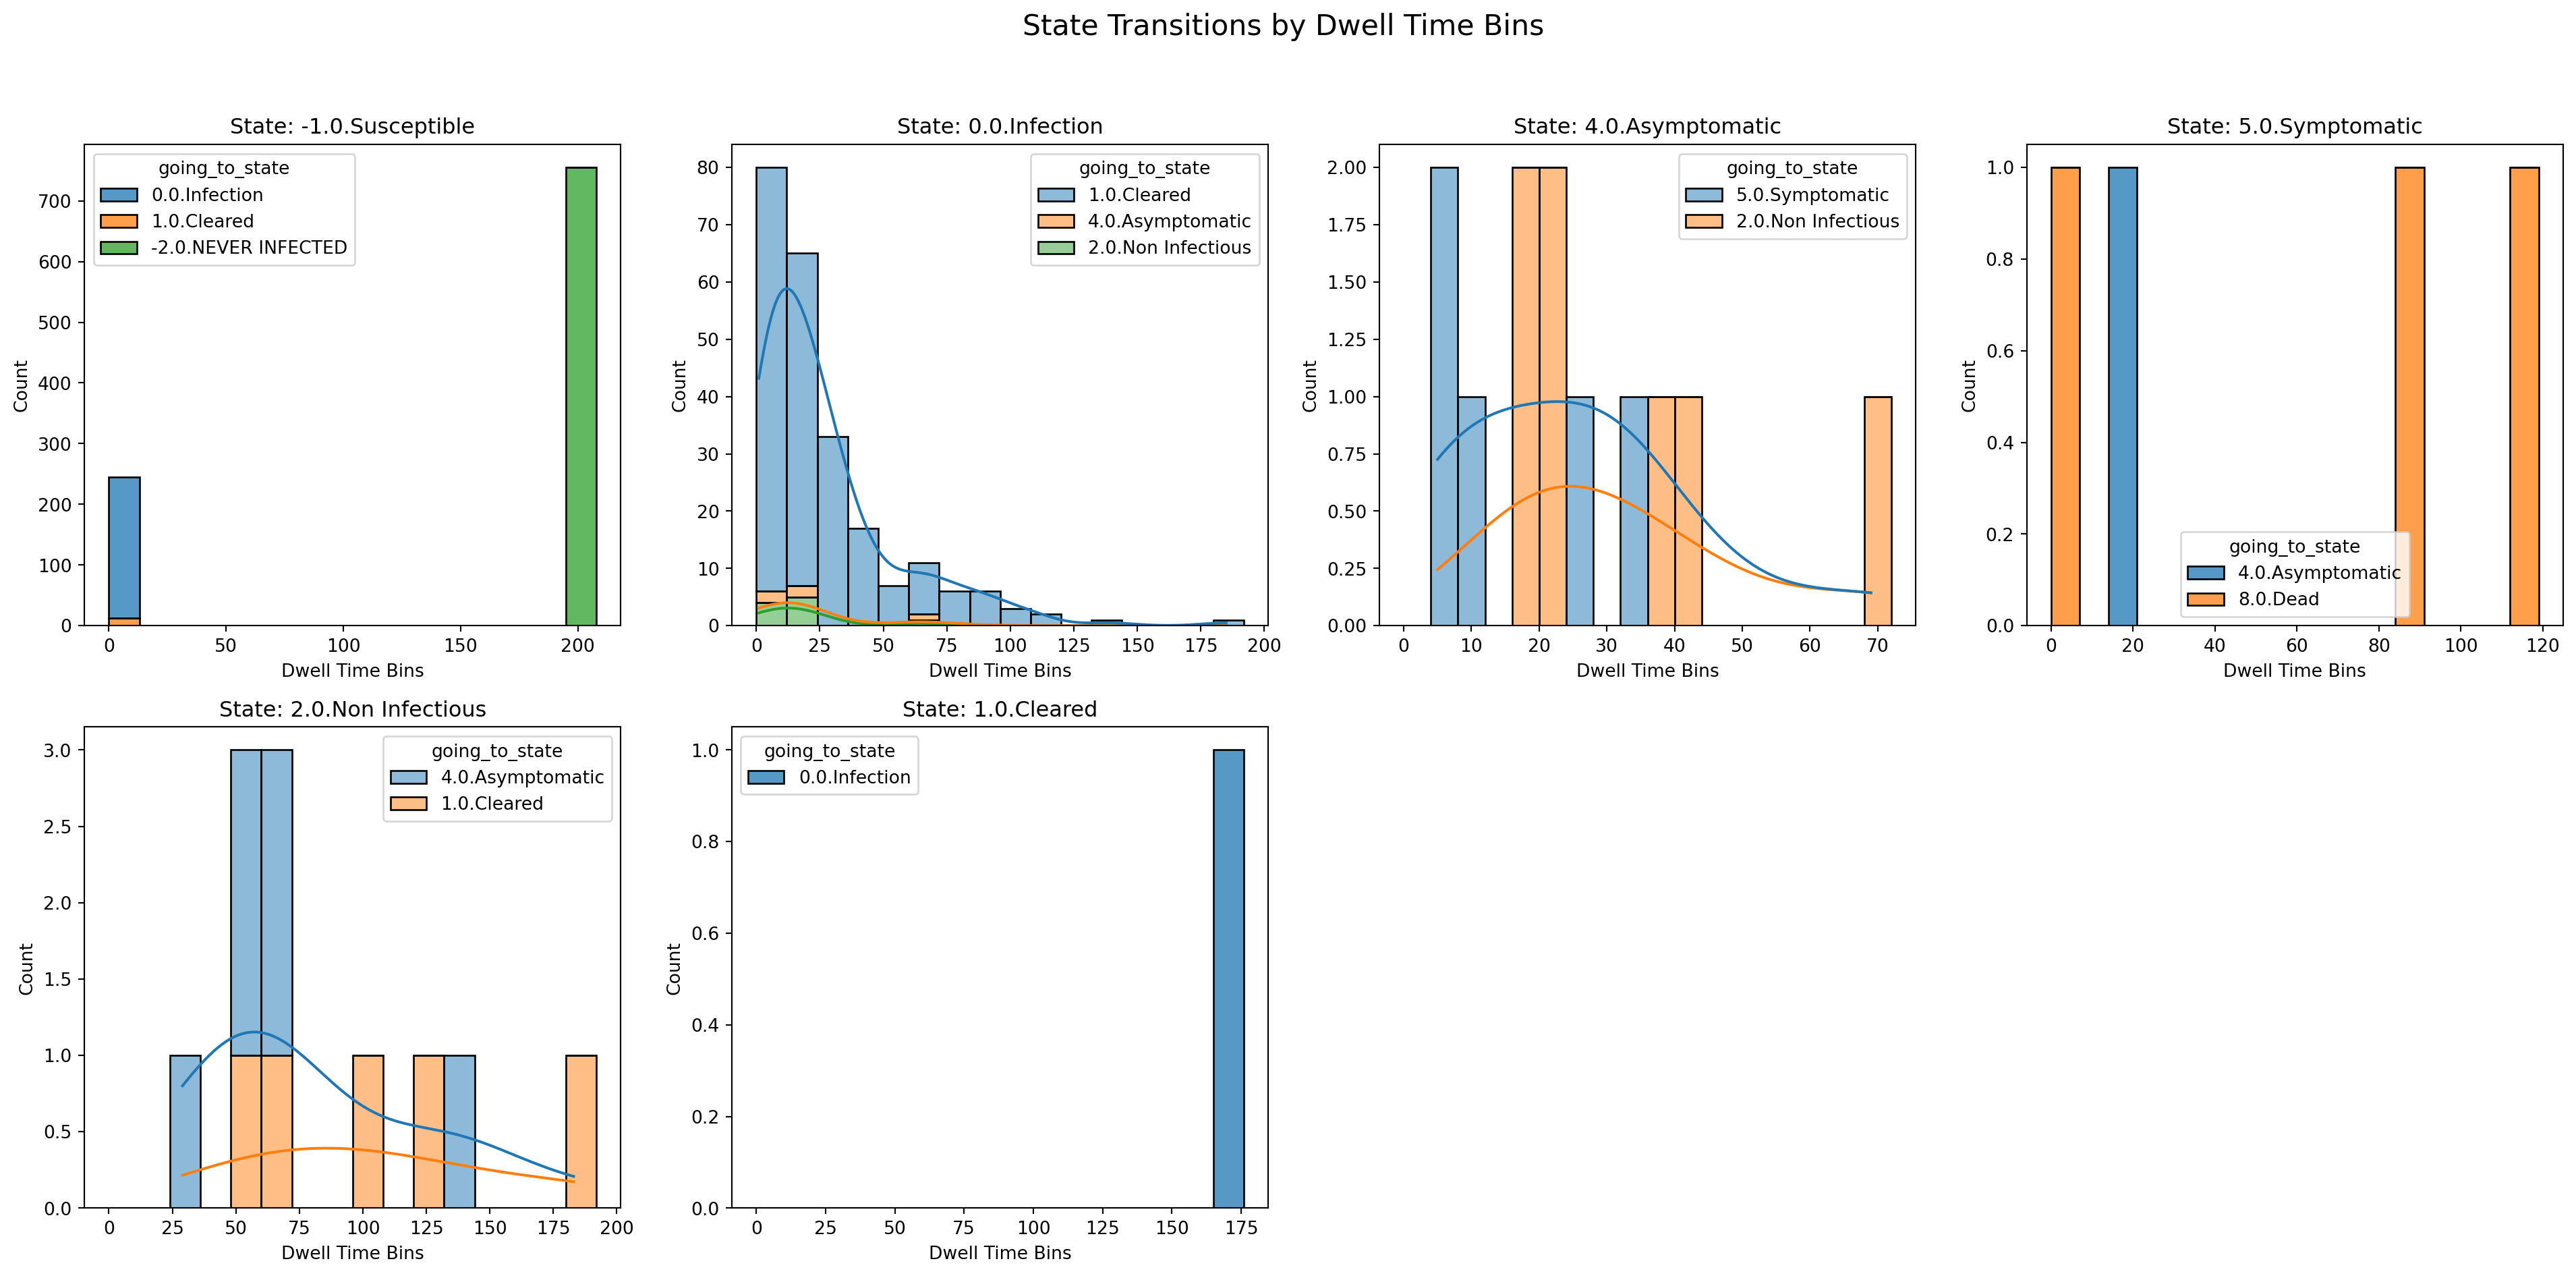
3. Survival Analysis
Kaplan-Meier survival curves for dwell times.
analyzer.plot('kaplan_meier')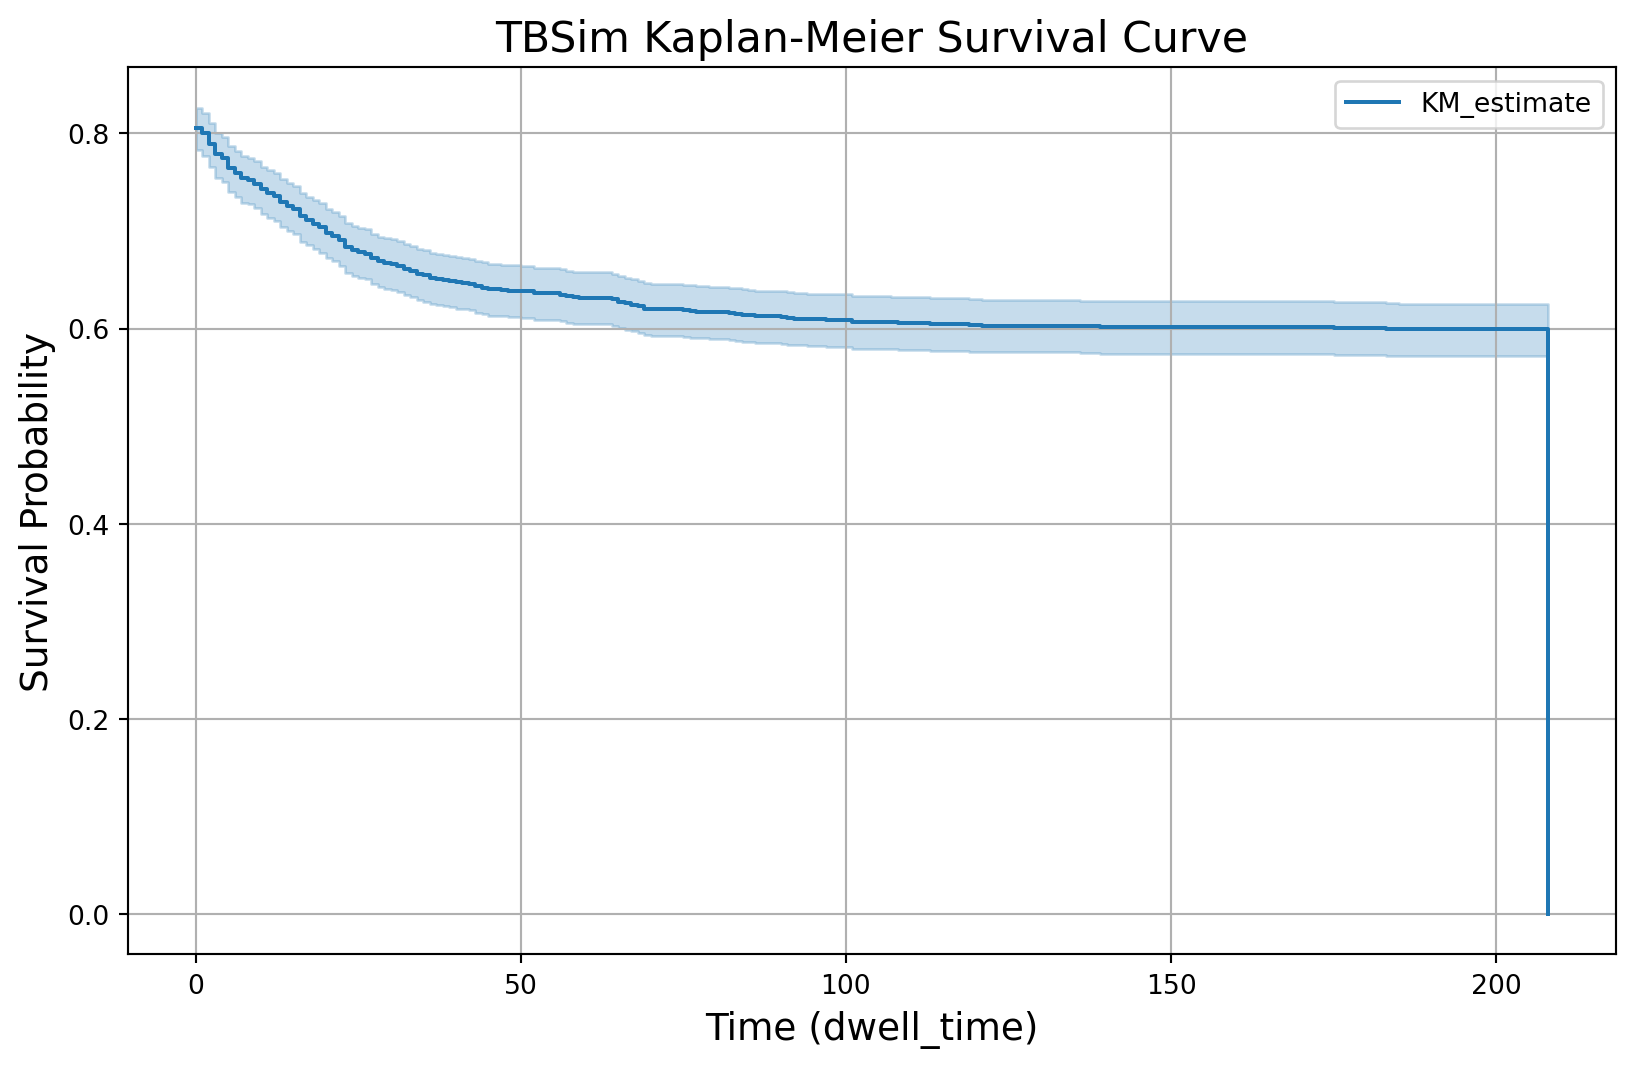
4. Validation
Observed dwell-time histograms for validation.
analyzer.plot('validation')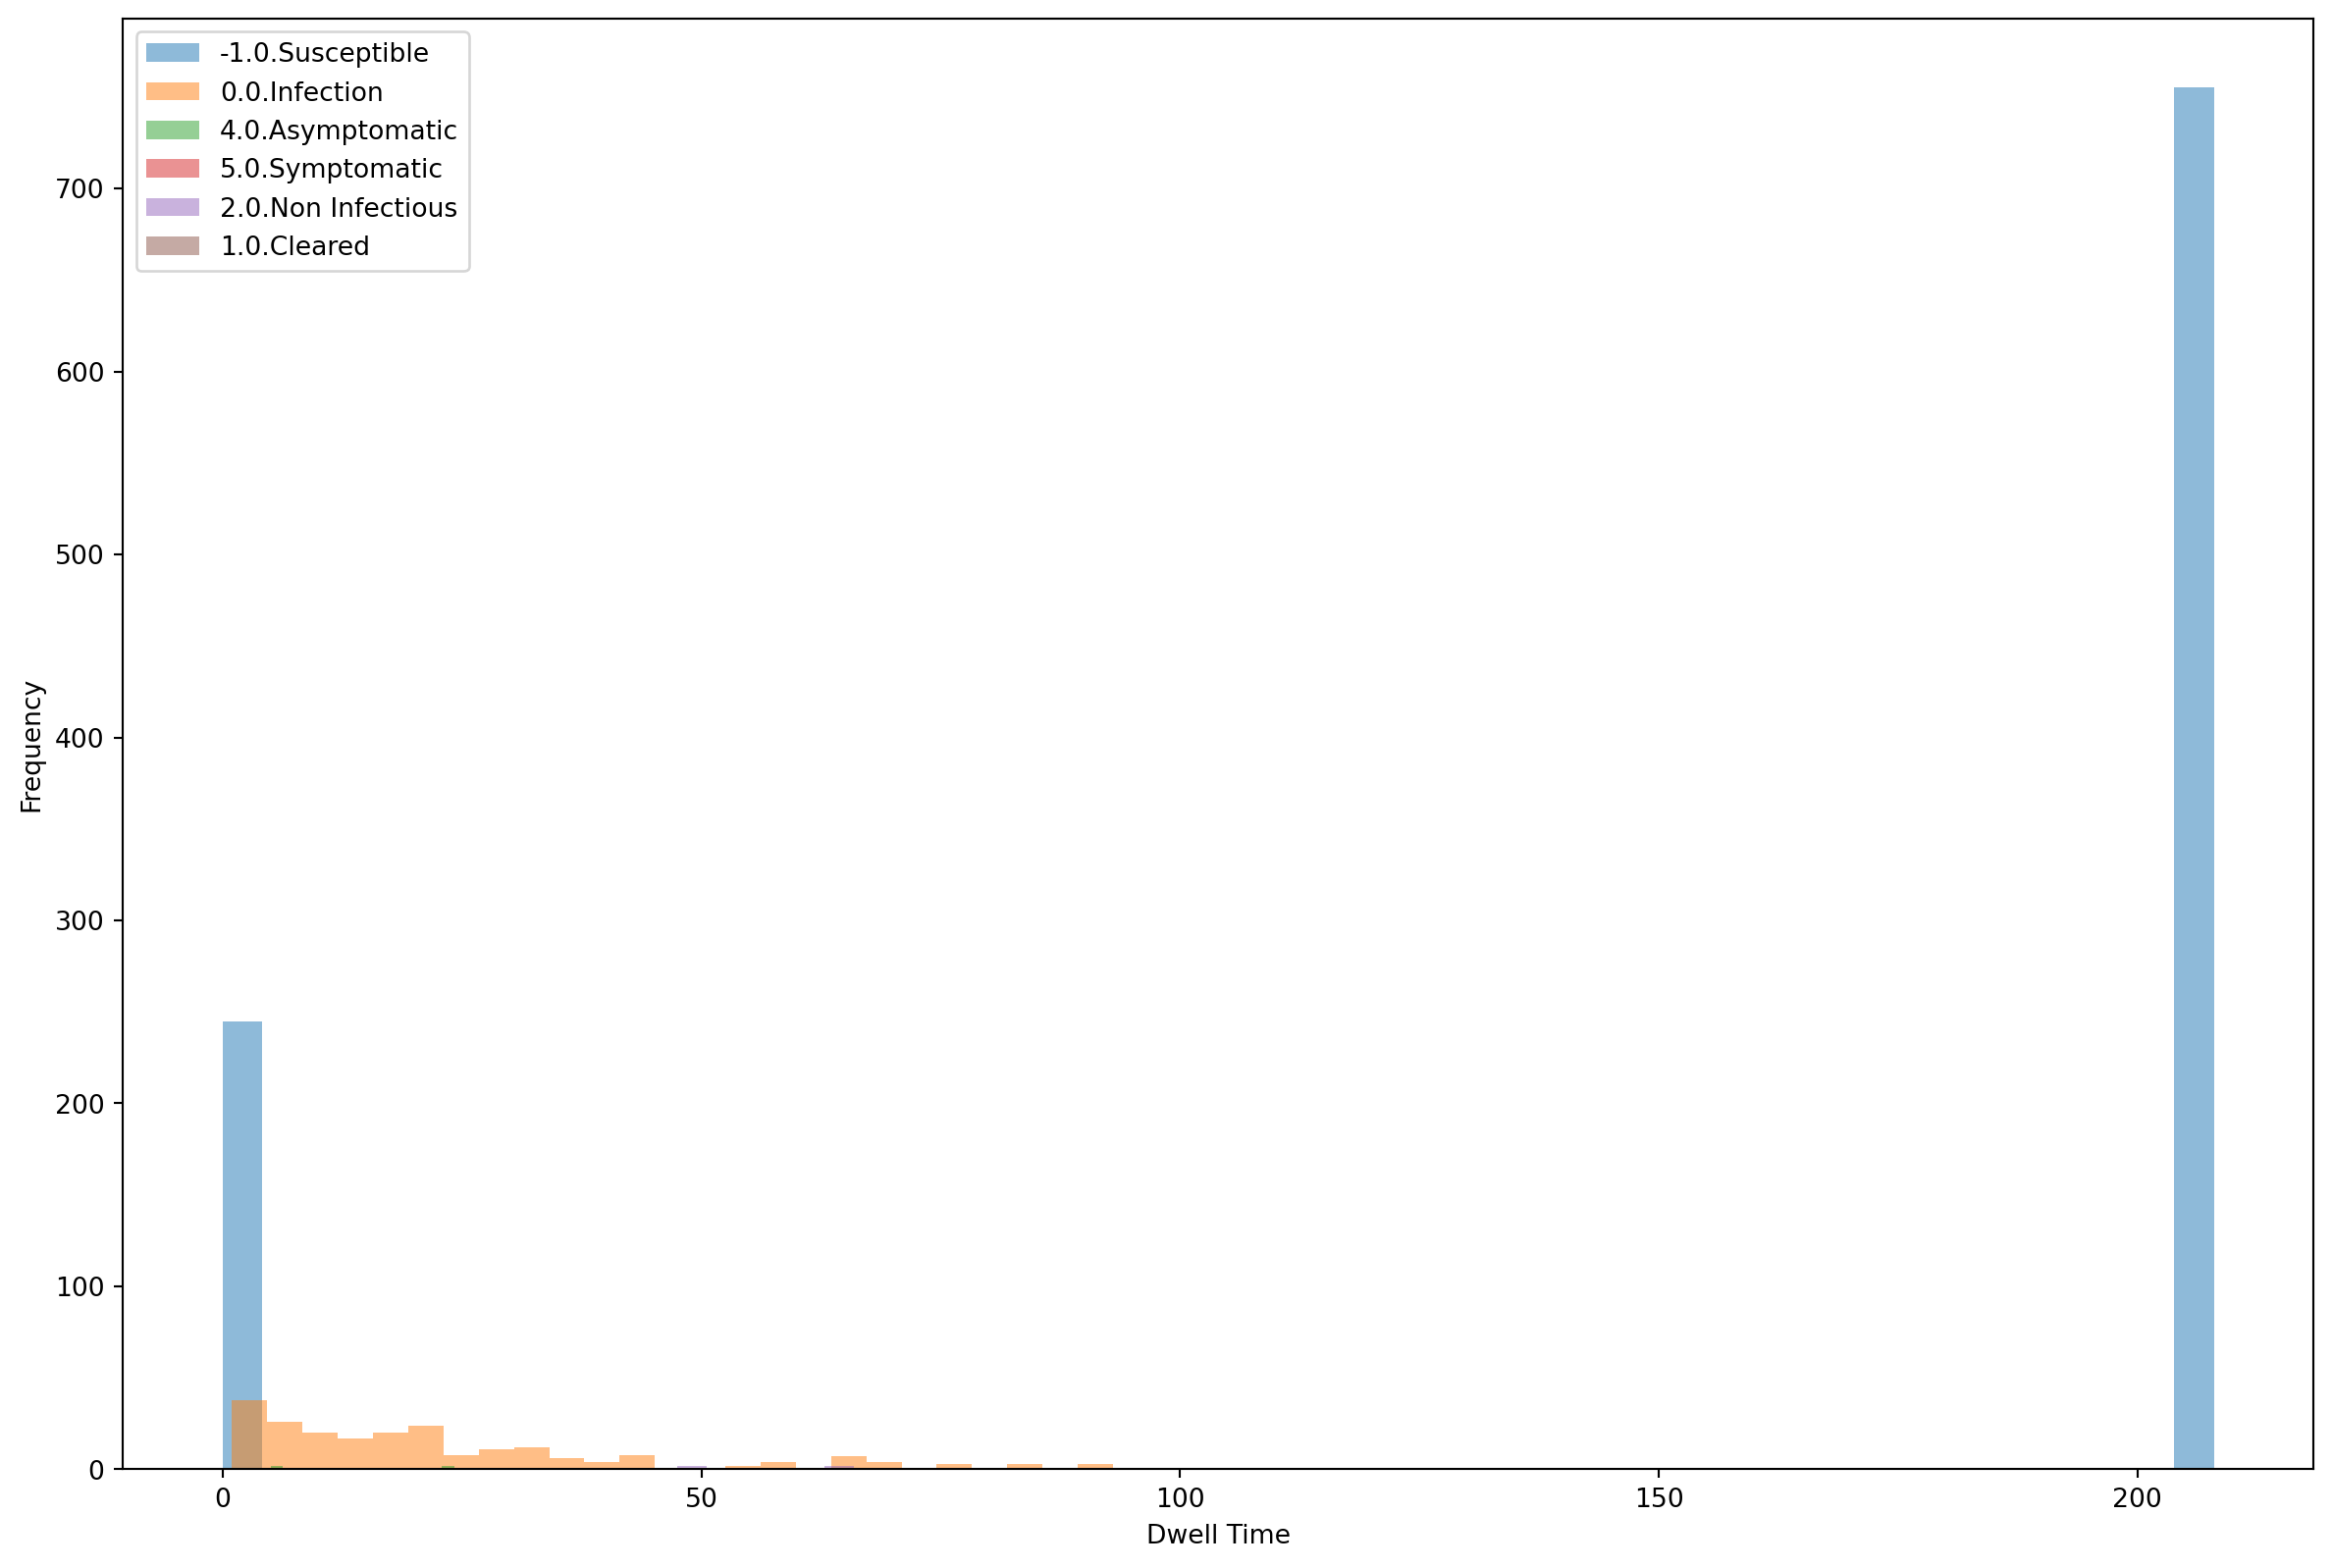
5. Loading from file
You can also create a DwellTime instance from a saved CSV file.
from tbsim.analyzers import DwellTime

file_path = analyzer.file_path
print(f'Generated data file: {file_path}')

plotter = DwellTime(file_path=file_path)
plotter.plot('histogram')
Generated data file: None
No dwell time data available to plot.