# Import required packages
import matplotlib.pyplot as plt
import numpy as np
import sciris as sc
import tbsim
import starsim as ssRunning TB HIV scenarios
Usage sample (with scenarios and plotting)
To use the hiv comorbidity features, you will need to add these 3 things to the simulation: - HIV disease to the disease list: Configure it as requested. Also, please note that if no intervention is specified, the model will use a initial prevalence and art coverage as specified in the HIV disease. - TB_HIV connector to the connector list: You will have the hability to update the values of each modifier as specified in the connector. - HivIntervention to the intervention list: The same intervention can be used for managing the art coverage and the prevalence depending on the specified parameters.
Build TB-HIV Simulation
def build_tbhiv_sim(simpars=None, tbpars=None, hivinv_pars=None) -> ss.Sim:
    """Build a TB-HIV simulation with current disease and intervention models."""

    # Set up the simulation parameters:
    default_simpars = dict(
        dt=ss.days(7),
        start=ss.date('1980-01-01'), stop=ss.date('2025-12-31'),
        rand_seed=123,
        verbose=0,
    )
    if simpars: default_simpars.update(simpars)

    # People:
    n_agents = 1000
    extra_states = [ss.FloatArr('SES', default=ss.bernoulli(p=0.3))]
    people = ss.People(n_agents=n_agents, extra_states=extra_states)

    # Disease 1: TB:
    pars = dict(beta=ss.peryear(0.01), init_prev=ss.bernoulli(p=0.25))
    if tbpars:
        pars.update(tbpars)
    tb = tbsim.TB(pars=pars)

    # Disease 2: HIV:
    hiv_pars = dict(init_prev=ss.bernoulli(p=0.10), init_onart=ss.bernoulli(p=0.50))
    hiv = tbsim.HIV(pars=hiv_pars)

    # Network:
    network = ss.RandomNet(pars=dict(n_contacts=ss.poisson(lam=2), dur=0))

    # Connector: TB-HIV
    connector = tbsim.TB_HIV_Connector()

    # Interventions: HivInterventions
    interventions = []
    if hivinv_pars is not None:
        hiv.update_pars(hiv_pars)
        hivinv_pars = hivinv_pars or dict(
            use_prevalence=True,
            use_art=True,
            prevalence=0.20,
            percent_on_ART=0.20,
            min_age=15,
            max_age=49,
            start=ss.date('2000-01-01'), stop=ss.date('2010-12-31'),
        )
        hiv_intervention = tbsim.HivInterventions(pars=hivinv_pars)
        interventions = [hiv_intervention]

    # Create the simulation:
    sim = ss.Sim(
        people=people,
        diseases=[tb, hiv],
        interventions=interventions,
        networks=network,
        connectors=[connector],
        pars=default_simpars,
    )
    return sim
Run HIV Intervention Scenarios
This function runs multiple intervention strategies, each with varying HIV prevalence, ART coverage, and target age ranges.
def run_scenarios():

    """Run the scenarios and return the results."""
    scenarios = {
        'baseline': None,
        'early_low_delivery_both':      dict(use_prevalence=True, use_art=True, prevalence=0.10, percent_on_ART=0.10,
                                        min_age=15, max_age=49,
                                        start=ss.date('1990-01-01'), stop=ss.date('2000-12-31')),

        'high_coverage_delivery_both':  dict(use_prevalence=True, use_art=True, prevalence=0.25, percent_on_ART=0.75,
                                        min_age=10, max_age=60,
                                        start=ss.date('2000-01-01'), stop=ss.date('2025-12-31')),

        'infection_1990_delivery':     dict(use_prevalence=True, use_art=False, prevalence=0.10,
                                        min_age=15, max_age=49,
                                        start=ss.date('1990-01-01'), stop=ss.date('2000-12-31')),

        'infection_2000_delivery':     dict(use_prevalence=True, use_art=False, prevalence=0.25,
                                        min_age=10, max_age=60,
                                        start=ss.date('2000-01-01'), stop=ss.date('2025-12-31')),

        'early_art_delivery':           dict(use_prevalence=False, use_art=True, percent_on_ART=0.10,
                                        min_age=15, max_age=49,
                                        start=ss.date('1990-01-01'), stop=ss.date('2025-12-31')),

        'high_art_delivery':            dict(use_prevalence=False, use_art=True, percent_on_ART=0.75,
                                        min_age=10, max_age=60,
                                        start=ss.date('2000-01-01'), stop=ss.date('2025-12-31')),
    }
    flat_results = {}
    for name, hivinv_pars in scenarios.items():
        print(f'Running scenario: {name}')
        sim = build_tbhiv_sim(hivinv_pars=hivinv_pars)
        sim.run()
        flat_results[name] = sim.results.flatten()
    return flat_results
Plotting Results
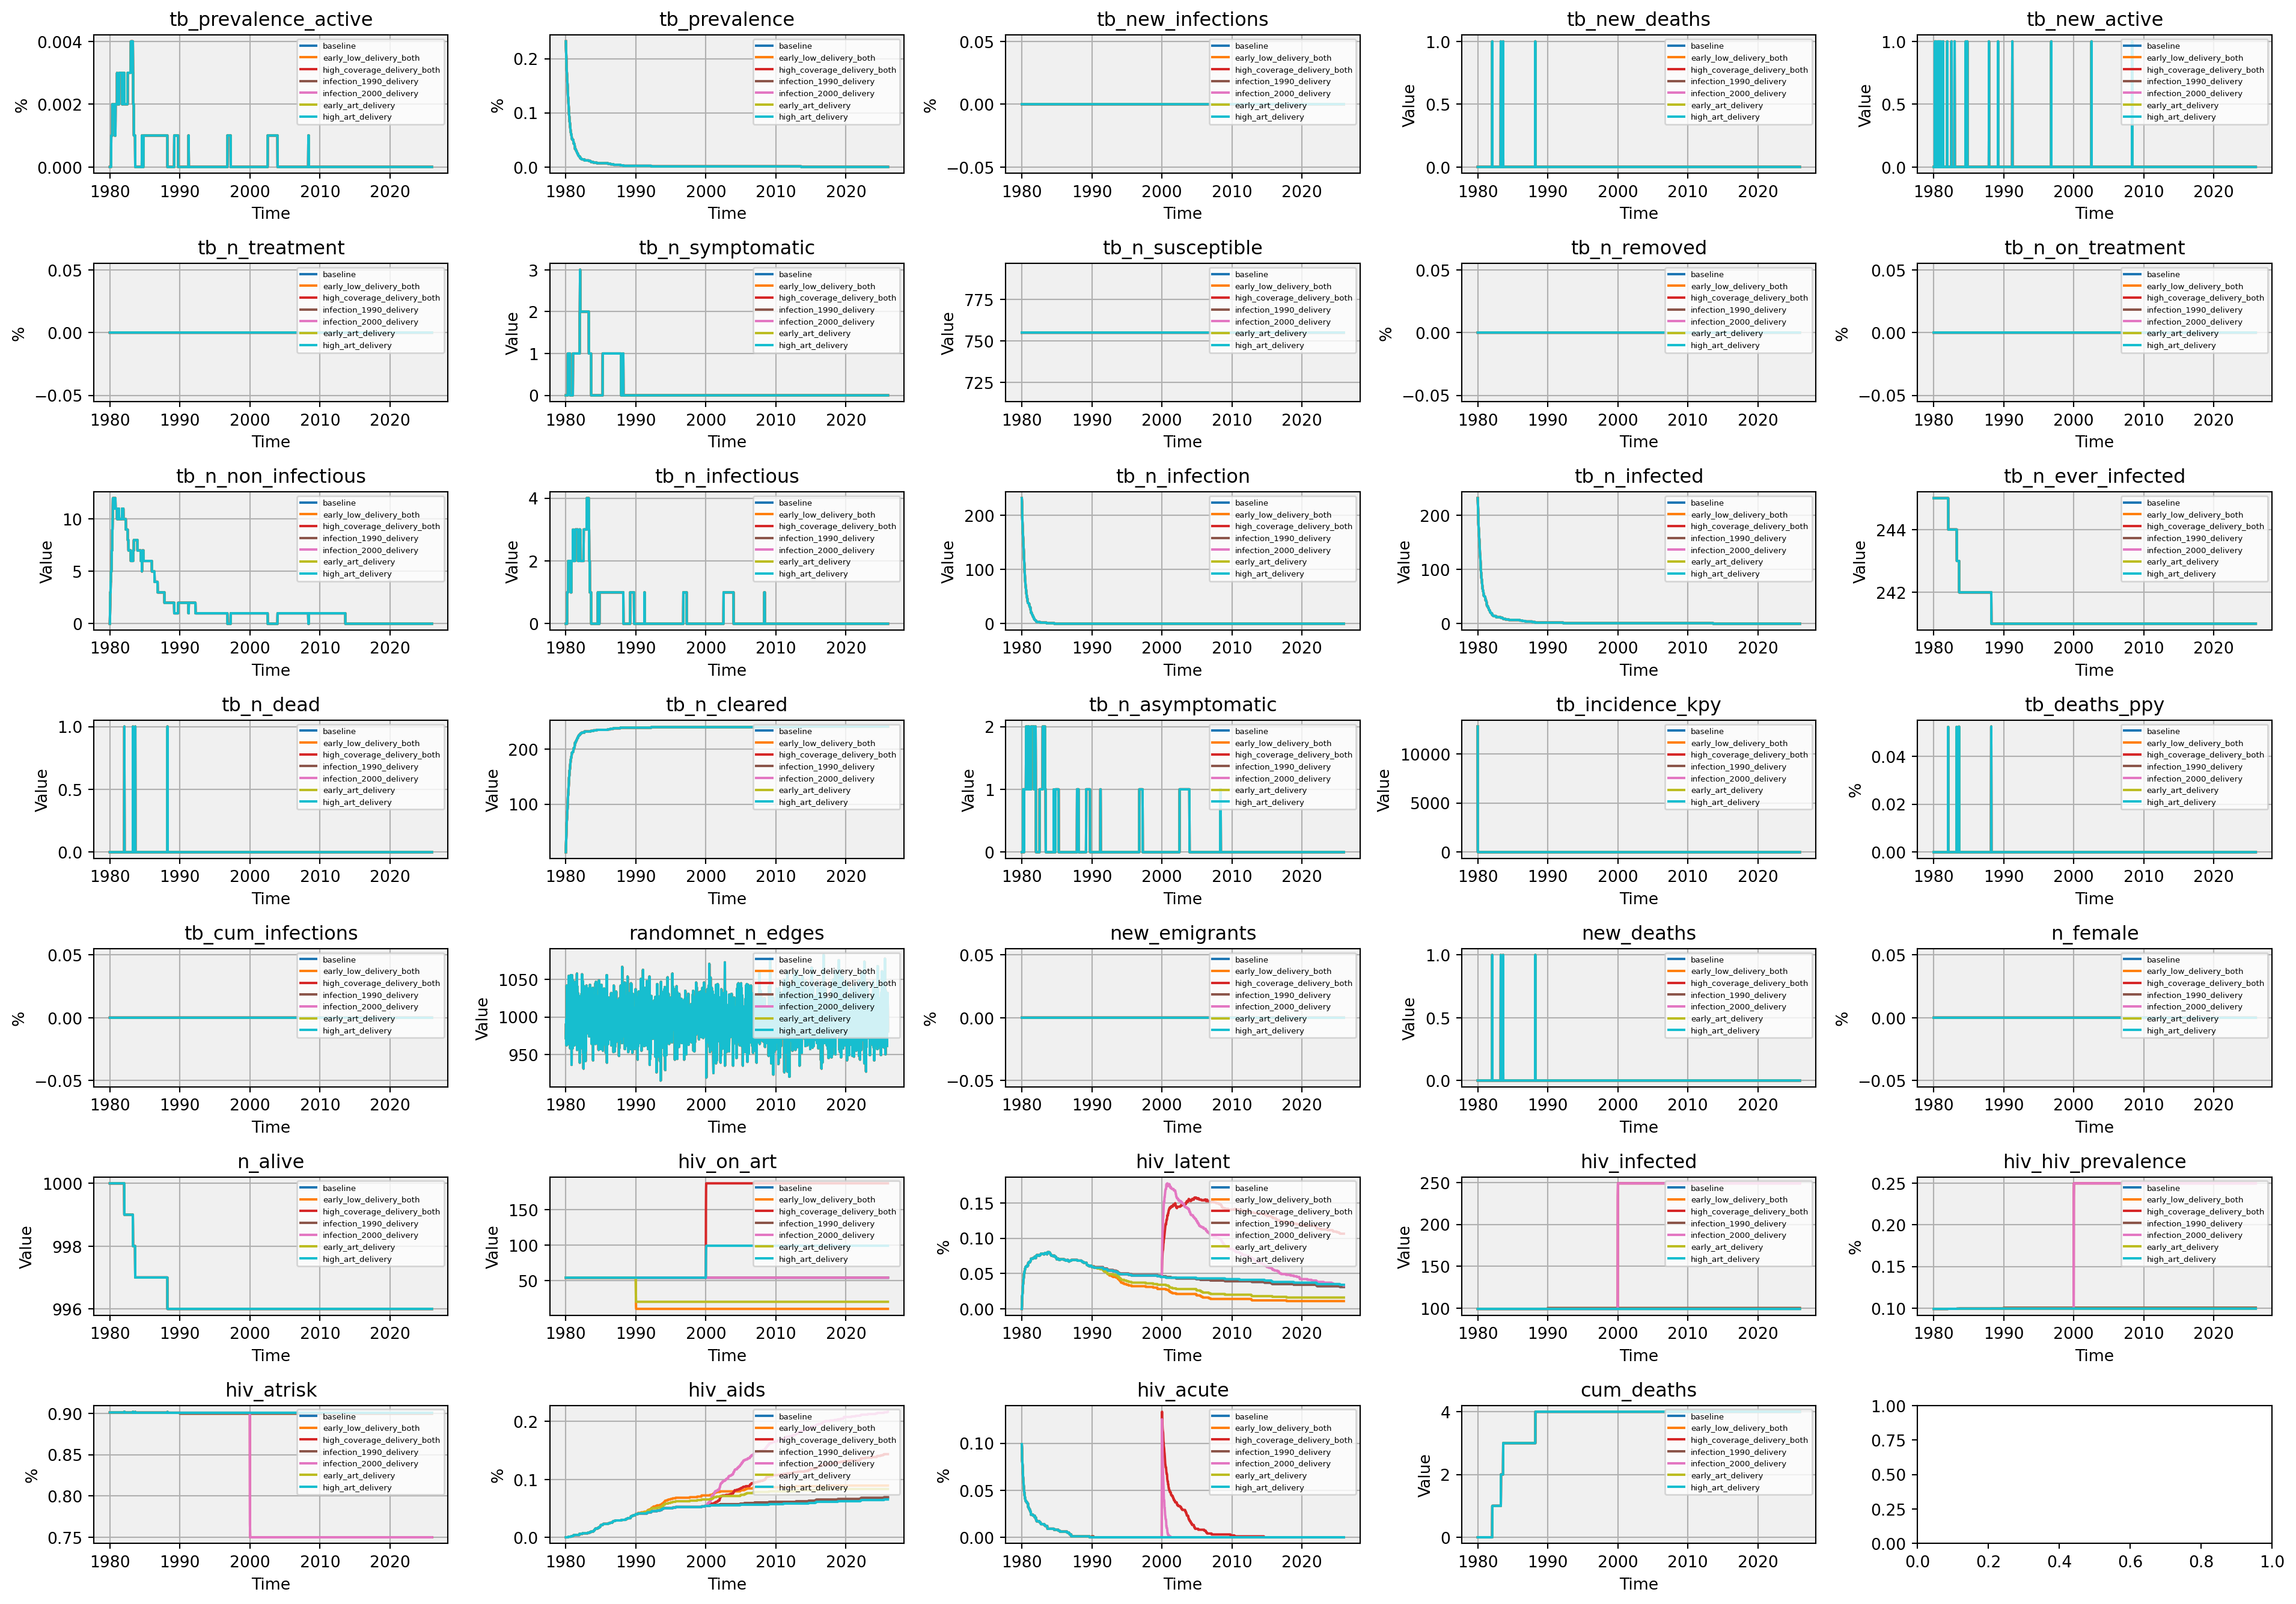
We extract relevant metrics across scenarios and generate time series plots to visualize their trends. Metrics can be filtered by keywords or exclusions.
def plot_results(flat_results, keywords=None, exclude=['15']):
    metrics = sorted({k for flat in flat_results.values() for k in flat.keys() if (not keywords or any(kw in k for kw in keywords))}, reverse=True)
    metrics = [m for m in metrics if not any(excl in m for excl in exclude)]
    n_metrics = len(metrics)
    if n_metrics > 0:
        n_cols = 5
        n_rows = int(np.ceil(n_metrics / n_cols))
        fig, axs = plt.subplots(n_rows, n_cols, figsize=(20, n_rows*2))
        axs = axs.flatten()
    cmap = plt.cm.get_cmap('tab10', len(flat_results))
    for i, metric in enumerate(metrics):
        ax = axs[i]
        for j, (scenario, flat) in enumerate(flat_results.items()):
            if metric in flat:
                result = flat[metric]
                ax.plot(result.timevec, result.values, label=scenario, color=cmap(j))
        ax.set_title(metric)
        ax.set_ylabel('%' if max(result.values) < 1 else 'Value')
        ax.set_xlabel('Time')
        ax.grid(True)
        ax.legend(loc='upper right', fontsize=6 if len(flat_results) <= 5 else 5)
        ax.set_facecolor('#f0f0f0')
    plt.tight_layout()
    plt.savefig(f'{sc.thisdir()}/tbhiv_scenarios.png', dpi=300)
    plt.show()
Plotting
# Run everything
flat_results = run_scenarios()
plot_results(flat_results)
Running scenario: baseline
Running scenario: early_low_delivery_both
Running scenario: high_coverage_delivery_both
Running scenario: infection_1990_delivery
Running scenario: infection_2000_delivery
Running scenario: early_art_delivery
Running scenario: high_art_delivery/home/runner/work/tbsim/tbsim/tbsim/comorbidities/hiv.py:271: RuntimeWarning:
Not enough candidates for ART. Expected: 95, Available: 45
ss.warn(msg=f"Not enough candidates for ART. Expected: {delta}, Available: {len(candidates)}")
/home/runner/work/tbsim/tbsim/tbsim/comorbidities/hiv.py:271: RuntimeWarning:
Not enough candidates for ART. Expected: 68, Available: 18
ss.warn(msg=f"Not enough candidates for ART. Expected: {delta}, Available: {len(candidates)}")
/home/runner/work/tbsim/tbsim/tbsim/comorbidities/hiv.py:271: RuntimeWarning:
Not enough candidates for ART. Expected: 55, Available: 5
ss.warn(msg=f"Not enough candidates for ART. Expected: {delta}, Available: {len(candidates)}")
/home/runner/work/tbsim/tbsim/tbsim/comorbidities/hiv.py:271: RuntimeWarning:
Not enough candidates for ART. Expected: 51, Available: 1
ss.warn(msg=f"Not enough candidates for ART. Expected: {delta}, Available: {len(candidates)}")
/home/runner/work/tbsim/tbsim/tbsim/comorbidities/hiv.py:271: RuntimeWarning:
Not enough candidates for ART. Expected: 50, Available: 0
ss.warn(msg=f"Not enough candidates for ART. Expected: {delta}, Available: {len(candidates)}")
/tmp/ipykernel_2828/1139370148.py:10: MatplotlibDeprecationWarning: The get_cmap function was deprecated in Matplotlib 3.7 and will be removed in 3.11. Use ``matplotlib.colormaps[name]`` or ``matplotlib.colormaps.get_cmap()`` or ``pyplot.get_cmap()`` instead.
cmap = plt.cm.get_cmap('tab10', len(flat_results))