This tutorial shows how to use a routine diagnostic intervention, that administers a test (the product) to a fraction of the eligible population. By default the eligible population is acute individuals. The eligibility criteria can can optionally passed to the intervention as a function that returns the indices (uids) of the eligibile individuals, or directly as an array of uids.
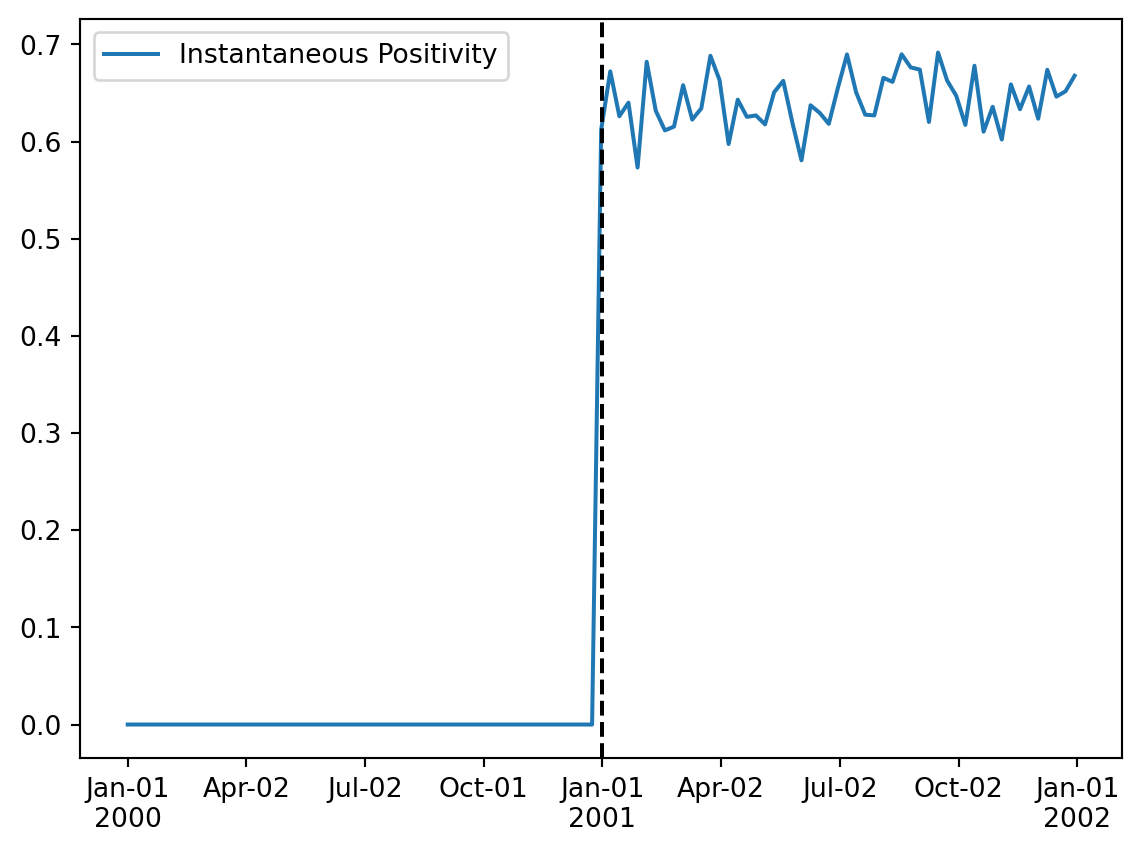
The sensitivity of the diagnostic product (the test), understood as the probability of receiving a positive diagnostic given that the individual is infected, can be set when instantiating the product.
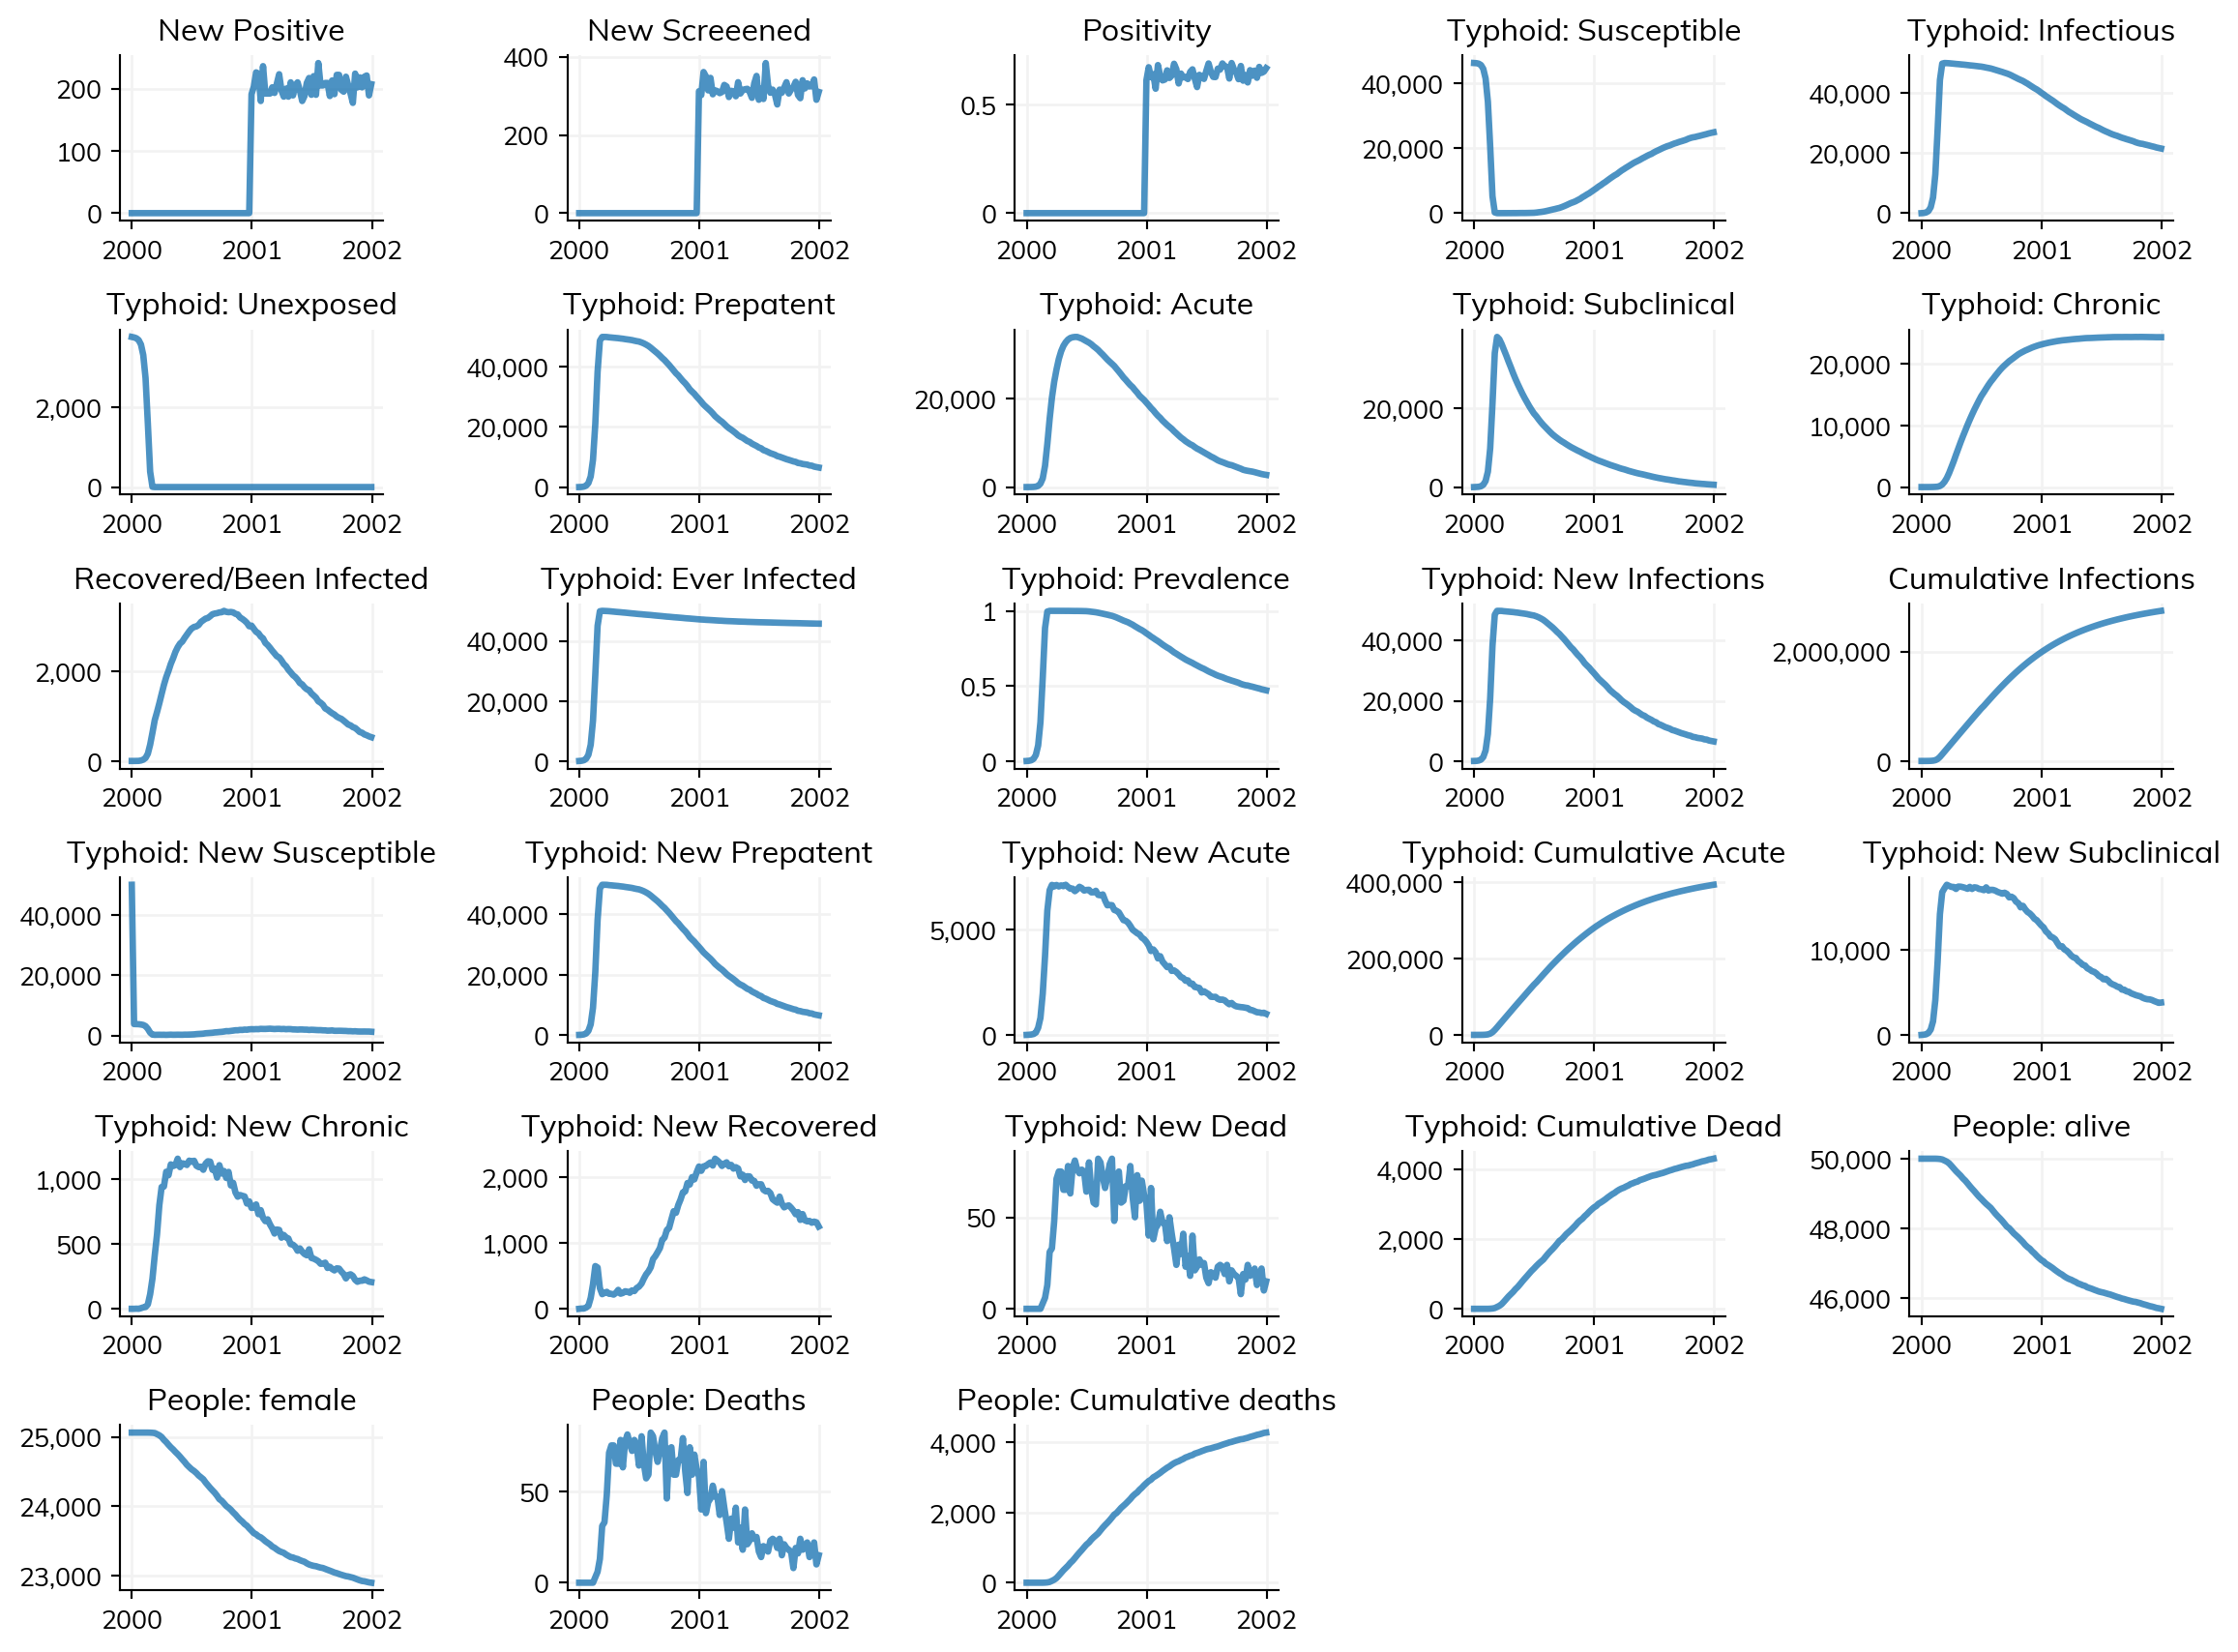
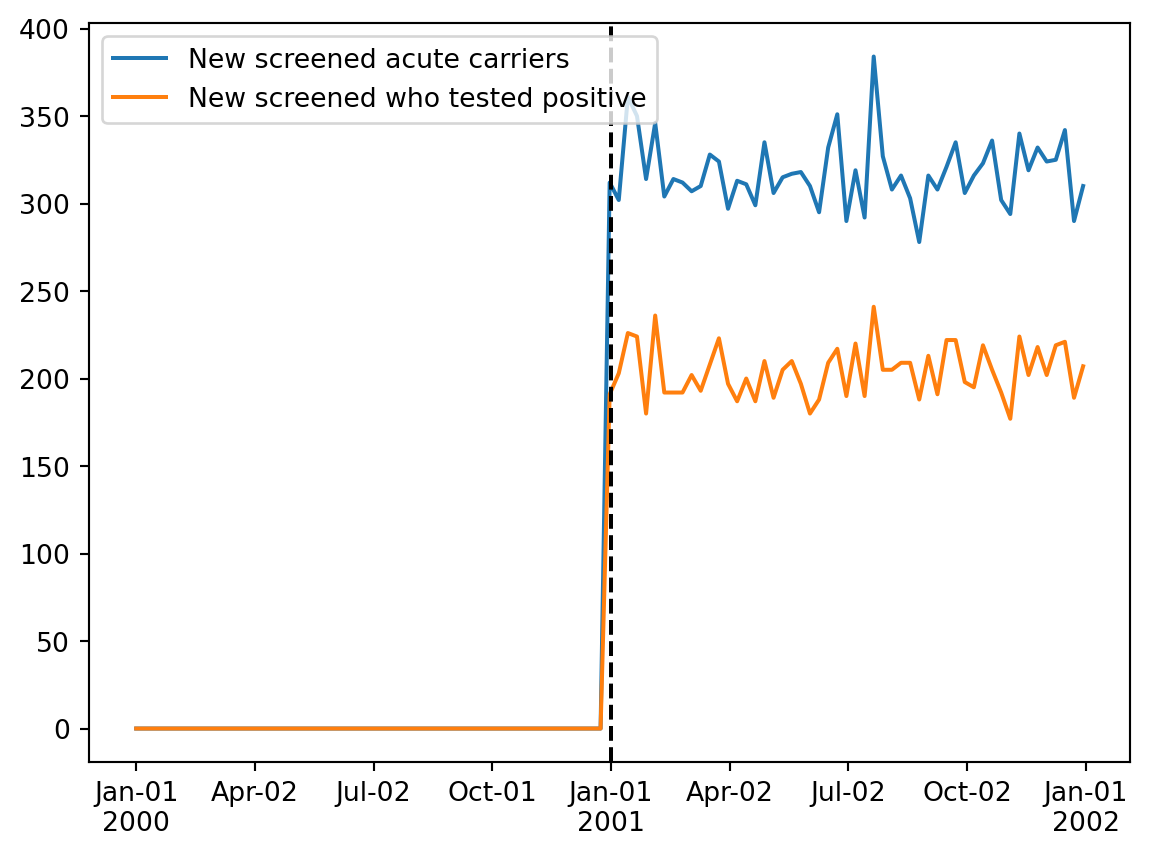
import starsim as ssimport typhoidsim as ty# Define high-level simulation parameterspars =dict( start =2000, # Starting year dur =2.0, # Duration of the simulation in years dt =7.0/365.0, # Timestep of 1 week, expressed in years verbose =0, # Do not print details of the run)# The populationppl = ss.People(50_000)# Person to person transmissionrandom_p2p = ss.RandomNet({'n_contacts': 10})# The diseasetyphoid = ty.Typhoid(pars={'tppi':0.1, 'init_seroprev':0.8, 'init_prev':0.001})# Create an intervention that routine screens symptoimatic (acute) inidividuals. # The diagnostic product is a test that is equivalent to a blood test with sensitivity of 0.65blood_test = ty.typhoid_test(pars=dict(sensitivity=ss.bernoulli(p=0.65)))screen_acute = ty.routine_acute_screening(product=blood_test, prob=0.3, start_year=2001.0) # Screen 30% of acute individuals every year starting in 2001# Now create two sims: a baseline sim and one with the interventionsim = ss.Sim(pars=pars, people=ppl, networks=random_p2p, diseases=typhoid, interventions=screen_acute)sim.run()