Results(Sim)
0. timevec: array(start=2000.01.01, stop=2001.01.01)
1. environmentalpool: Results(EnvironmentalPool)
1.0. timevec: array(start=2000.01.01, stop=2001.01.01)
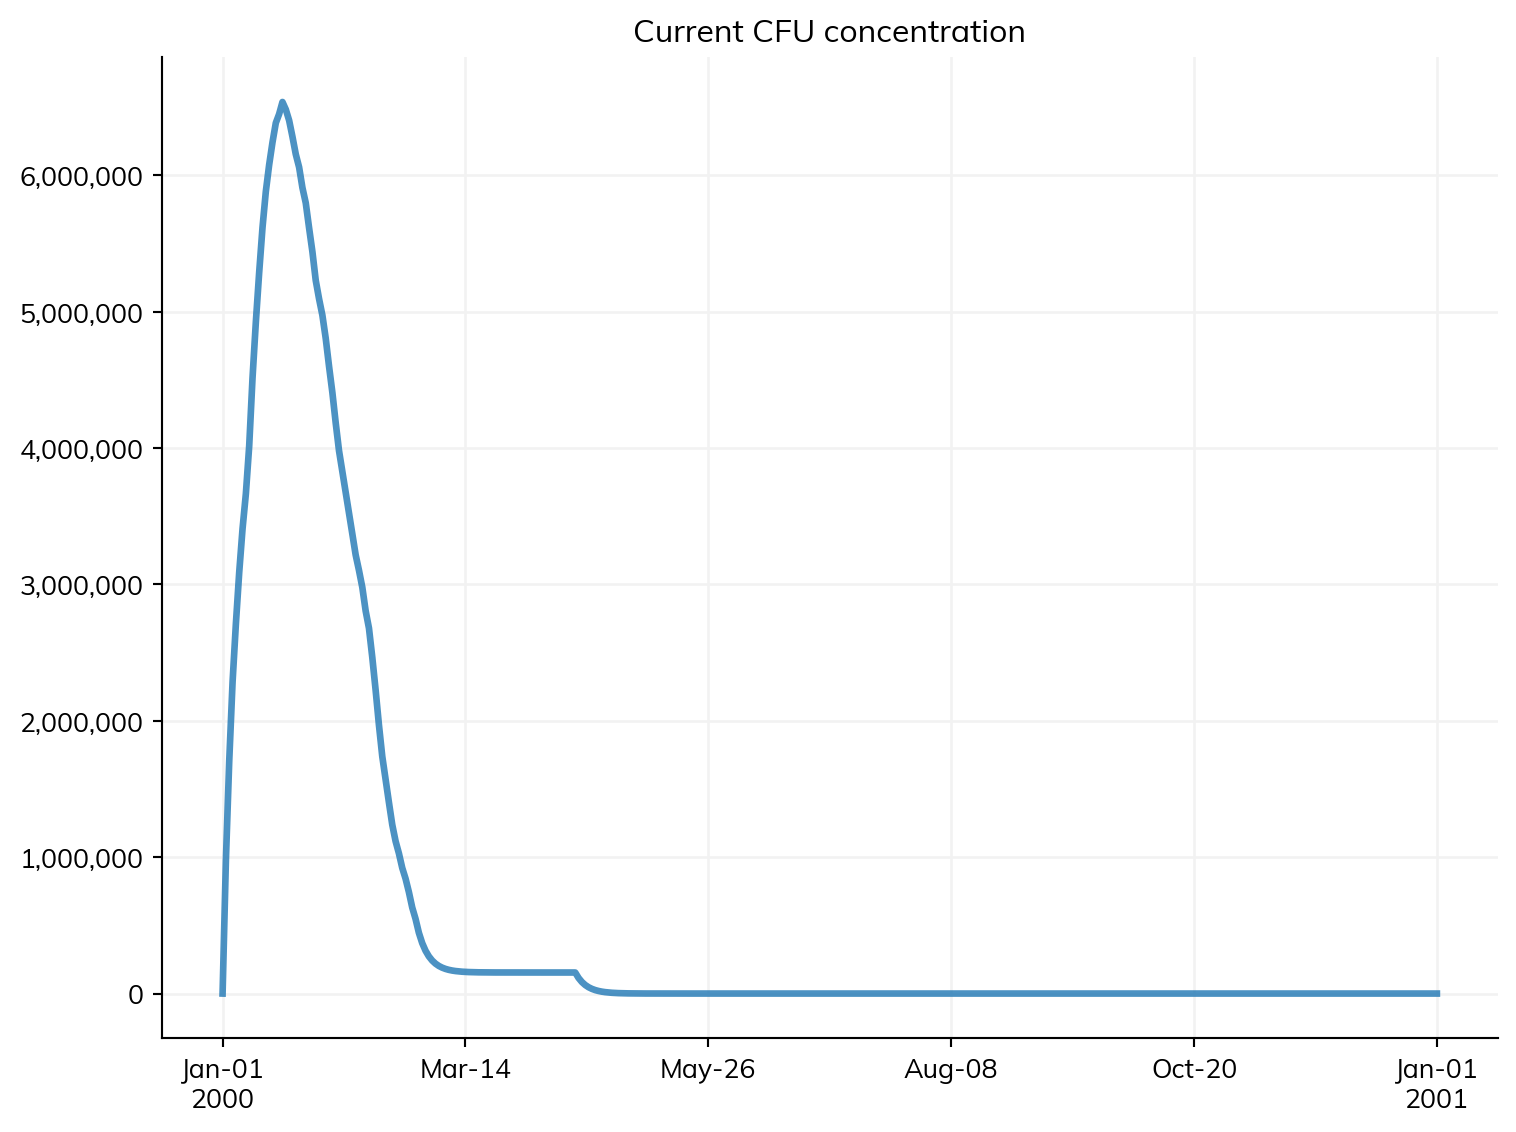
1.1. cfu_conc: Result(min=0, mean=622387, max=6.53795e+06)
1.2. cfu_num: Result(min=0, mean=622387, max=6537952)
2. typhoid: Results(Typhoid)
2.0. timevec: array(start=2000.01.01, stop=2001.01.01)
2.1. n_susceptible: Result(min=9204, mean=9294.08, max=9345)
2.2. n_infected: Result(min=0, mean=4.75956, max=50)
2.3. n_unexposed: Result(min=655, mean=701.027, max=747)
2.4. n_prepatent: Result(min=0, mean=1.45355, max=49)
2.5. n_acute: Result(min=0, mean=0.647541, max=8)
2.6. n_subclinical: Result(min=0, mean=2.65847, max=33)
2.7. n_chronic: Result(min=0, mean=0, max=0)
2.8. n_recovered: Result(min=0, mean=0.136612, max=3)
2.9. n_infected_ever: Result(min=49, mean=49.9945, max=50)
2.10. prevalence: Result(min=0, mean=0.000475956, max=0.005)
2.11. new_infections: Result(min=0, mean=0.136612, max=49)
2.12. cum_infections: Result(min=49, mean=49.9945, max=50)
2.13. new_susceptible: Result(min=655, mean=726.563, max=9951)
2.14. new_prepatent: Result(min=0, mean=0.00273224, max=1)
2.15. new_acute: Result(min=0, mean=0.0245902, max=2)
2.16. cum_acute: Result(min=0, mean=8.74317, max=9)
2.17. new_subclinical: Result(min=0, mean=0.112022, max=11)
2.18. new_chronic: Result(min=0, mean=0, max=0)
2.19. new_recovered: Result(min=0, mean=0.136612, max=3)
2.20. new_deaths: Result(min=0, mean=0, max=0)
2.21. cum_deaths: Result(min=0, mean=0, max=0)
3. n_alive: Result(min=10000, mean=10000, max=10000)
4. n_female: Result(min=5013, mean=5013, max=5013)
5. new_deaths: Result(min=0, mean=0, max=0)
6. new_emigrants: Result(min=0, mean=0, max=0)
7. cum_deaths: Result(min=0, mean=0, max=0)