import starsim as ss

S, I, R = ss.states('S I R')
W = ss.State(people=False) # Bacteria in the water: a count, not people
K = 1e5                    # Amount of bacteria at which infection is half its maximum

infection = S >> I @ ss.perday(0.5) * W.n / (W.n + K)
recovery  = I >> R @ ss.days(5)
shedding  = ss.outside >> W @ ss.perday(10) * I.n  # Each infectious person sheds 10 a day
decay     = W >> ss.dead @ ss.days(30)          # Bacteria survive 30 days on average
cholera = ss.Disease(infection, recovery, shedding, decay, init=dict(I=0.001), name='cholera')Cholera with a water reservoir
Cholera spreads mostly through water rather than from person to person: infected people shed bacteria into the water, the bacteria decay over weeks, and susceptible people are infected by drinking it. A model of it needs a state that is not people at all: the amount of bacteria in the water, W. This page models W as a state of the disease that holds a count rather than people, following the model of Codeço (2001).
The model
Infection depends on the bacteria in the water, with a dose-response curve that saturates: the rate is β W / (W + K), where K is the amount of bacteria at which the rate is half its maximum. W and K are amounts; Codeço writes them as concentrations, which is the same model for a fixed volume of water (taken here as one unit).
| Parameter | Value | Meaning |
|---|---|---|
| β | 0.5 per day | Maximum rate of infection, when the water is saturated with bacteria |
| K | 100,000 | Amount of bacteria at which the rate is half its maximum |
| Infectious period | 5 days | Mean time in I (exponential) |
| Shedding | 10 per day | Bacteria shed into the water by each infectious person |
| Survival of bacteria | 30 days | Mean time bacteria survive in the water |
| Population | 10,000 | |
| Infectious at the start | 0.1% |
W.n and I.n are counts (the amount of bacteria, and the number of people infectious), where a bare I in a rate would be the fraction of people infectious (I.frac). ss.outside and ss.dead are outside the model: shedding adds bacteria from outside it, and decay removes them. The diagram, from diagram(), in which W is slanted since it is not people:
cholera.diagram()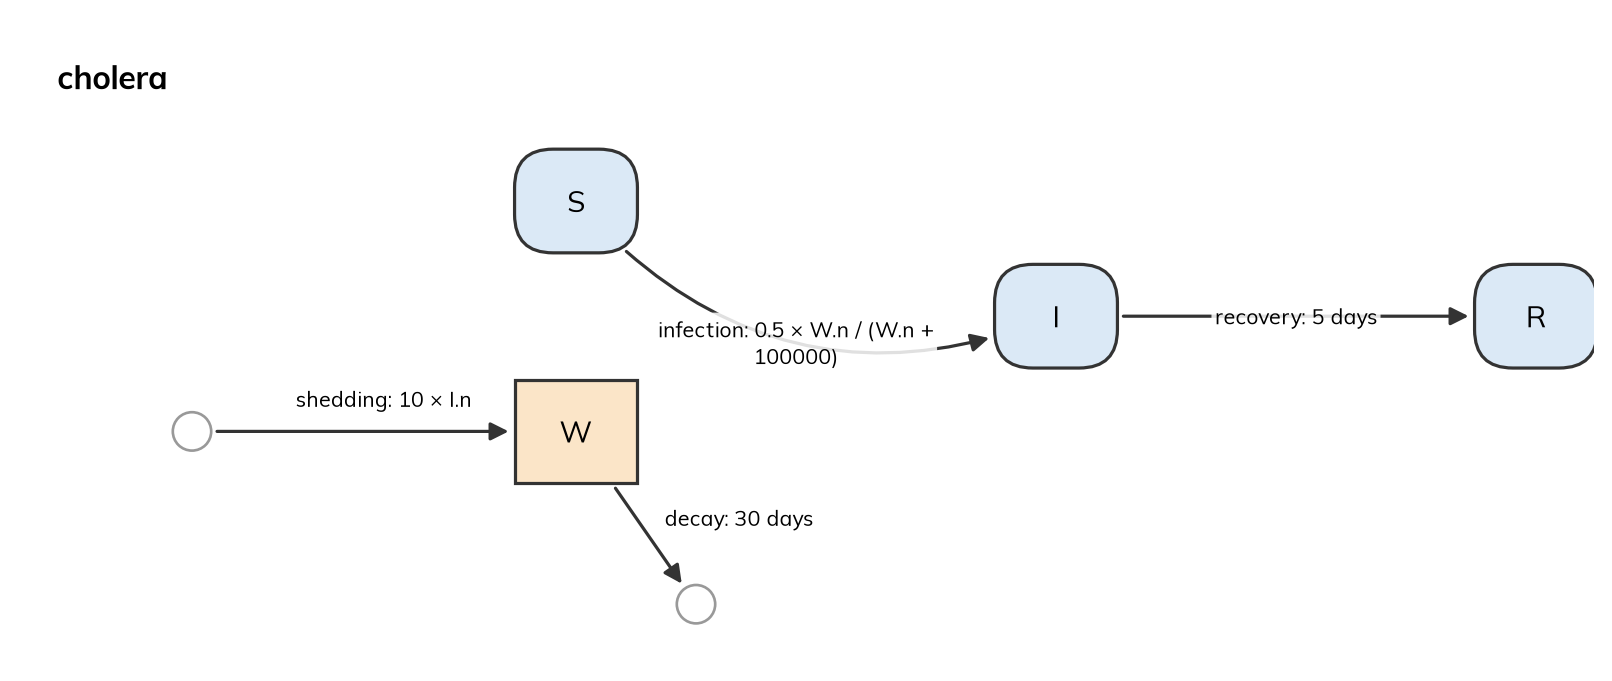
cholera.equations()dS/dt = -perday(0.5) * W.n / (W.n + 100000) * S
dI/dt = perday(0.5) * W.n / (W.n + 100000) * S - I / dur_I
dR/dt = I / dur_I
dW/dt = -W / dur_W + perday(10) * I.nResult
sim = ss.Sim(cholera, total_pop=10_000, stop=ss.days(200))
sim.run()
sim.plot('cholera')
Sim: cholera, 10,000 people, as an ODE, days 0 to 200
Done in 0.0026 s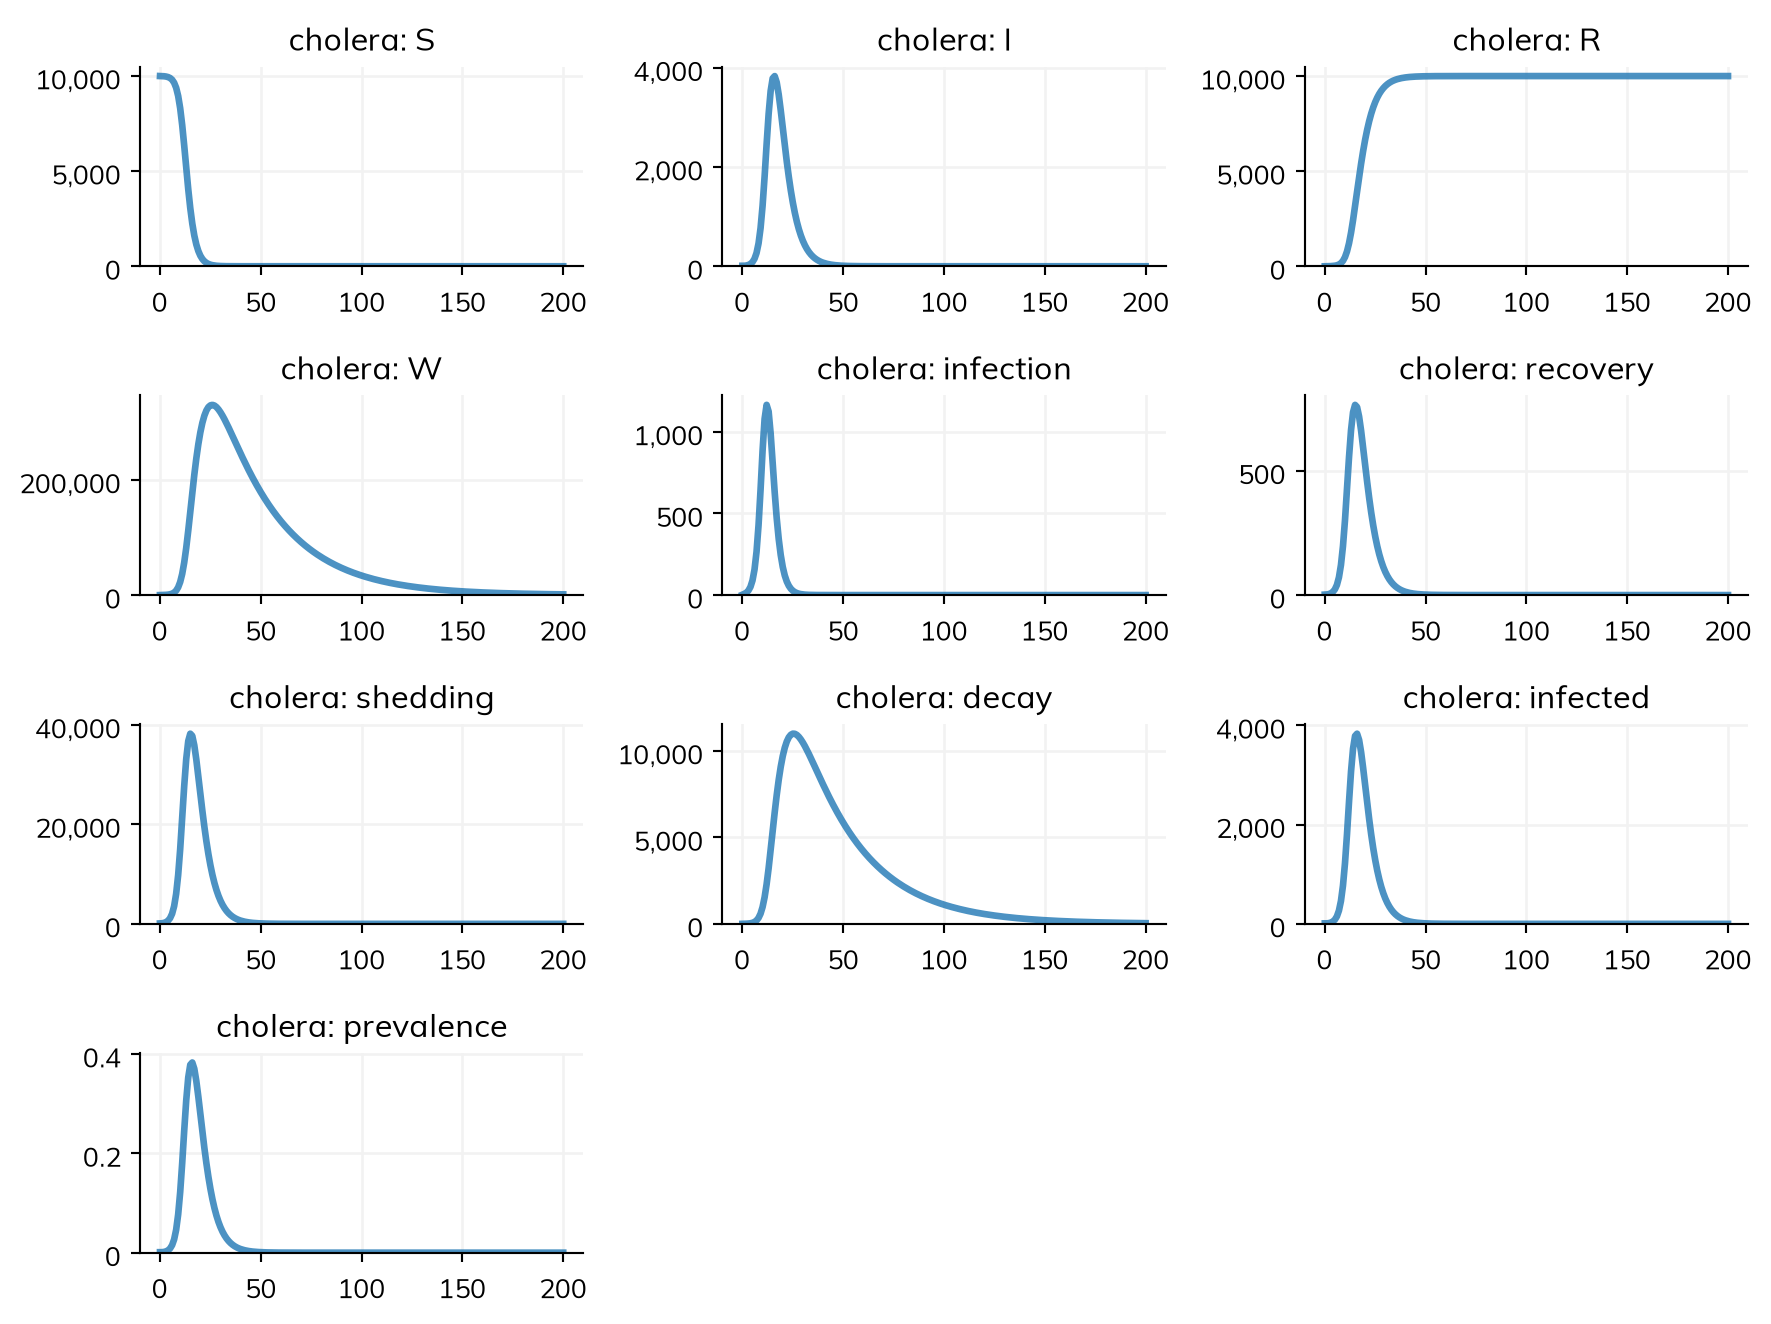
Bacteria build up in the water while people are infectious, and outlast them: the amount in the water peaks after the number infectious does, and keeps infecting people as the epidemic declines. Since W is a count and not people, it is left out of the population, and it stays a count when the people are run as agents (n_agents=).
Going further
- Diseases covers states that are counts, and flows from and to
ss.dead. - The library’s cholera model,
ssl.diseases.Cholera, is a fuller version of the same model, with a latent period, asymptomatic infection, and deaths (see the library’s diseases). - Codeço CT (2001). Endemic and epidemic dynamics of cholera: the role of the aquatic reservoir. BMC Infectious Diseases 1:1.