import starsim as ss

def make_sir():
    S, I, R = ss.states('S I R')
    infection = S >> I @ 0.3*ss.by(vaccinated=[1.0, 0.1])*I
    recovery  = I >> R @ ss.days(10)
    sir = ss.Disease(infection, recovery, init=dict(I=0.001), name='sir')
    sir.stratify(vaccinated={False: 1, True: 0})
    return sir

campaign = ss.Event(dict(vaccinated=True), when=ss.days(10), p=0.5, name='campaign')Vaccination as a stratification
In many compartmental models, vaccination is not part of the disease at all: the population is split into the vaccinated and the unvaccinated, vaccination moves people from one group to the other, and the vaccinated are infected at a lower rate. This is how summer2, Atomica, and many published models write it, and it keeps the disease model the same whatever the vaccination program. This page writes an SIR this way, with a campaign that vaccinates half of the population on day 10, and compares it with no vaccination.
The model
| Parameter | Value | Meaning |
|---|---|---|
| β | 0.3 per day | Rate of infection of the unvaccinated |
| Vaccine effect | 90% | The vaccinated are infected at 10% of the rate of the unvaccinated |
| Infectious period | 10 days | Mean time in I (exponential) |
| R0 | 3 | Before vaccination |
| Campaign | Day 10 | Vaccinates 50% of people, whatever their state |
| Population | 10,000 | |
| Infectious at the start | 0.1% |
stratify() splits each state in two, with everyone unvaccinated at the start ({False: 1, True: 0}), and ss.by() in the rate of infection multiplies it by 1 for the unvaccinated and 0.1 for the vaccinated. The campaign is a delivery that moves people to the vaccinated group: it needs no vaccine product, since the effect of vaccination is in the stratification. The diagram, from diagram(), is an SIR’s, since the vaccinated and unvaccinated groups split each state:
make_sir().diagram()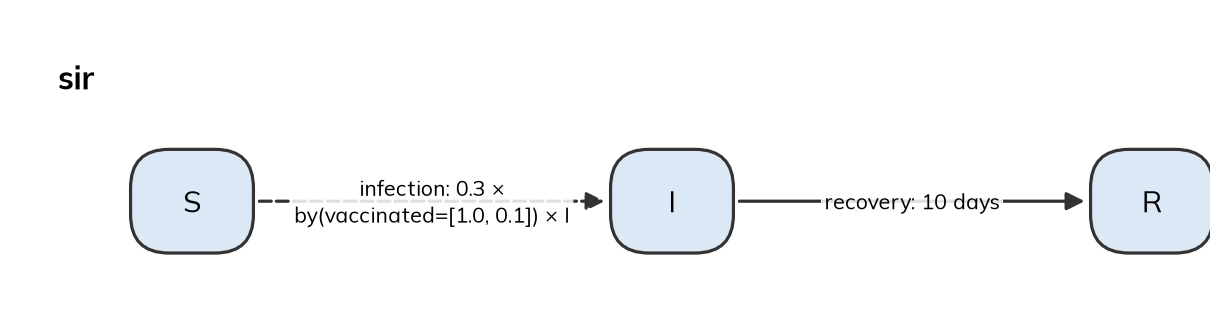
Result
sims = {
    'No vaccination': ss.Sim(make_sir(), total_pop=10_000, stop=ss.days(150), verbose=0),
    'Campaign': ss.Sim(make_sir(), interventions=campaign, total_pop=10_000, stop=ss.days(150), verbose=0),
}
msim = ss.parallel(sims)
msim.plot('sir')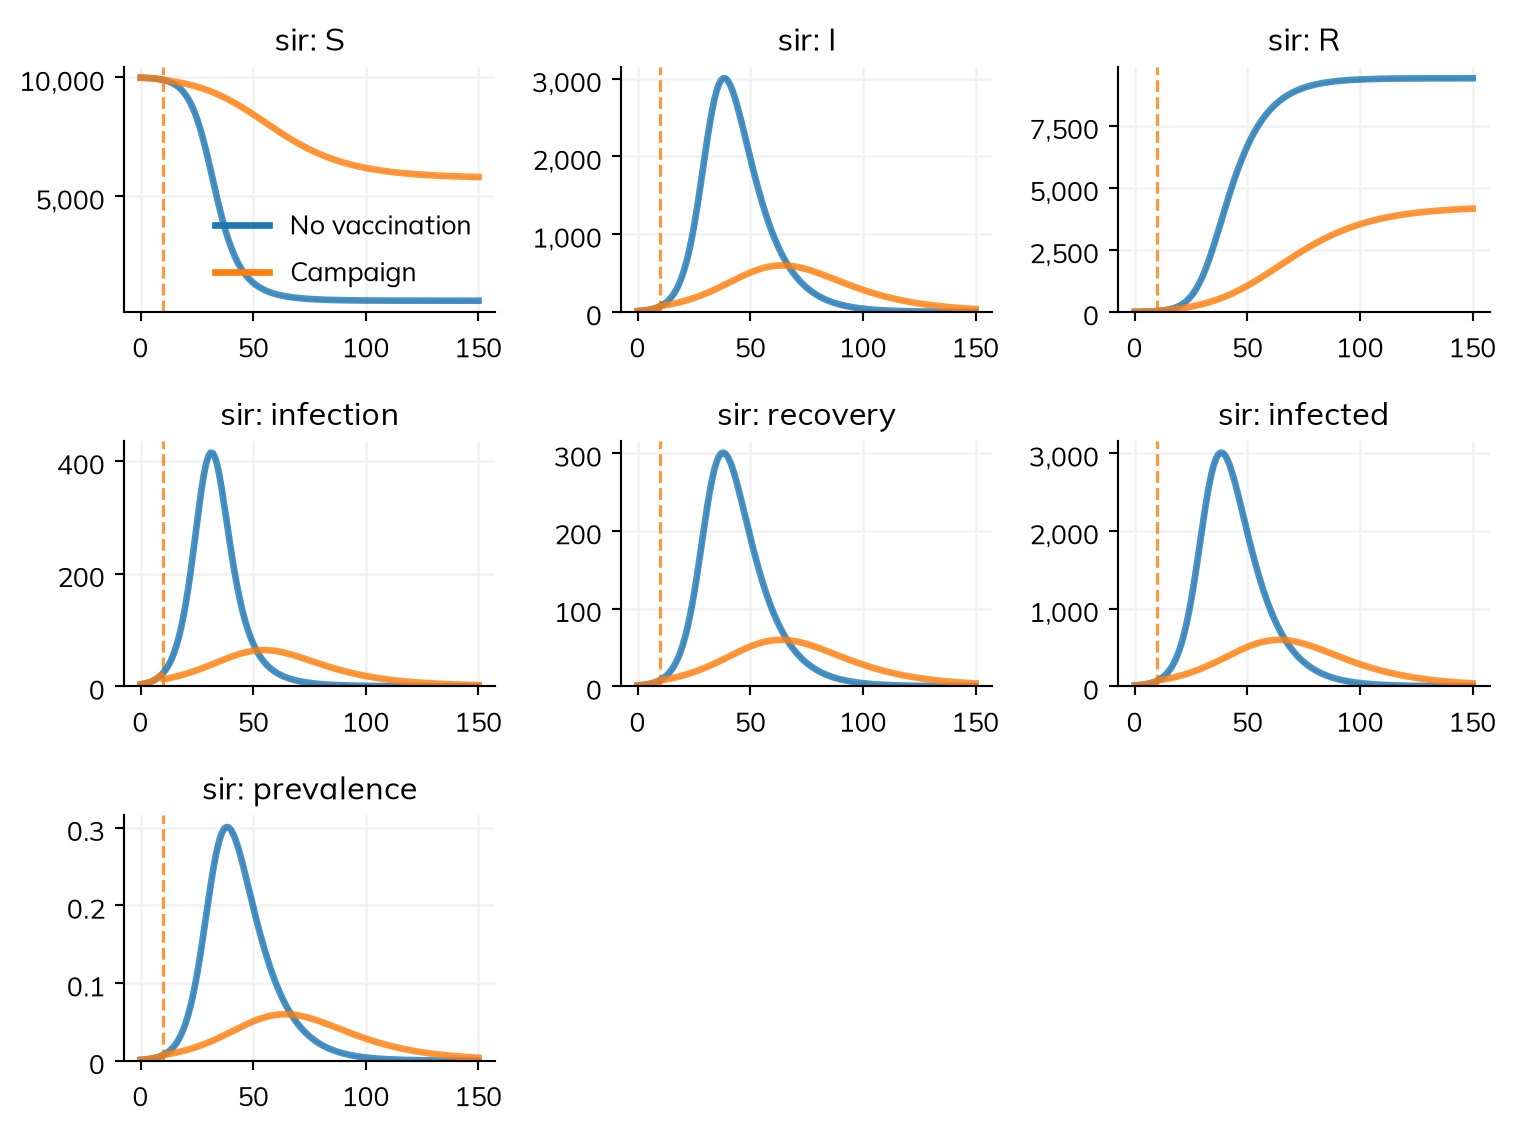
Vaccinating half of the population lowers the reproduction number from 3 to 3 × (0.5 + 0.5 × 0.1) = 1.65: that is R0 weighted by the susceptibility of each group, for a population that is still almost all susceptible. By day 10 some people have already been infected, so the effective reproduction number on the day of the campaign is a little lower. The epidemic infects under half as many people:
msim.summarize().loc['sir_infection']| value | |
|---|---|
| scenario | |
| No vaccination | 9,395 |
| Campaign | 4,184 |
Going further
- T5 – Interventions and scenarios vaccinates with a vaccine product instead, which is simpler when the vaccine is the topic.
- T7 – Stratification and co-transmission covers transfers between strata, of which vaccination is one.
- summer2 and Atomica show models from those frameworks, which use this pattern.