import starsim as ss

S, I, R = ss.states('S I R')
infection = S >> I @ 0.05*I
recovery  = I >> R @ ss.days(10)
sir = ss.Disease(infection, recovery, init=dict(I=0.001), name='sir')
sir.stratify(age={0: 0.3, 15: 0.5, 65: 0.2})  # The lower edge of each age group, and its fraction of people

contacts = ss.contacts(ages=[0, 15, 65], matrix=[[8, 5, 2], [3, 6, 2], [3, 5, 3]])Age groups and contacts
People of different ages mix differently: children have the most contacts, and most of them with other children. An age-structured model splits each state by age group, and a contact matrix says how many contacts a day a person in each group has with people in each other group. With contacts, β is the rate of infection per contact, and the force of infection on group i is β times the sum over groups j of the contacts of i with j times the fraction of j who are infectious. This page builds an age-structured SIR with a contact matrix written by hand, as in the age-structured models of Keeling and Rohani (2008, chapter 3). Then it uses a real country’s population and contact matrices, one for each setting (home, school, work, and the rest of the community), and closes schools by removing one of them.
The model
| Parameter | Value | Meaning |
|---|---|---|
| β | 0.05 per contact | Rate of infection per contact with an infectious person, per day |
| Infectious period | 10 days | Mean time in I (exponential) |
| Age groups | 0–14, 15–64, 65+ | With 30%, 50%, and 20% of people |
| Contacts | see the matrix | Contacts a day of a person in each group (rows) with each group (columns) |
| Population | 100,000 | |
| Infectious at the start | 0.1% | In each group |
The contact matrix, with the rows and columns in the order 0–14, 15–64, 65+:
| 0–14 | 15–64 | 65+ | |
|---|---|---|---|
| 0–14 | 8 | 5 | 2 |
| 15–64 | 3 | 6 | 2 |
| 65+ | 3 | 5 | 3 |
The diagram, from diagram(), is the same as an SIR’s: the age groups split each state, and don’t change the transitions.
sir.diagram()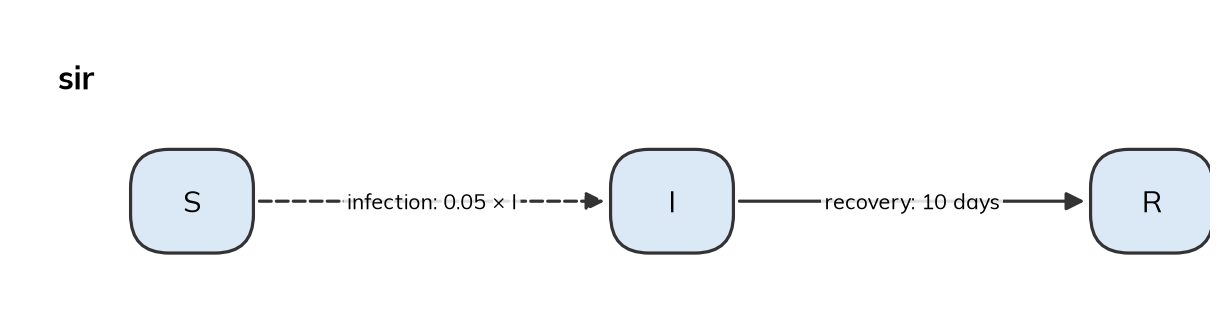
Result
sim = ss.Sim(sir, networks=contacts, total_pop=100_000, stop=ss.days(100))
sim.run()
sim.results.sir.I.by('age').plot()
Sim: sir, 100,000 people, as an ODE, days 0 to 100
sir: R0 = 6.29, with 100 infectious at the start
Done in 0.0024 s; sir: 99,592 infections; at most 53,597 infectious, on day 17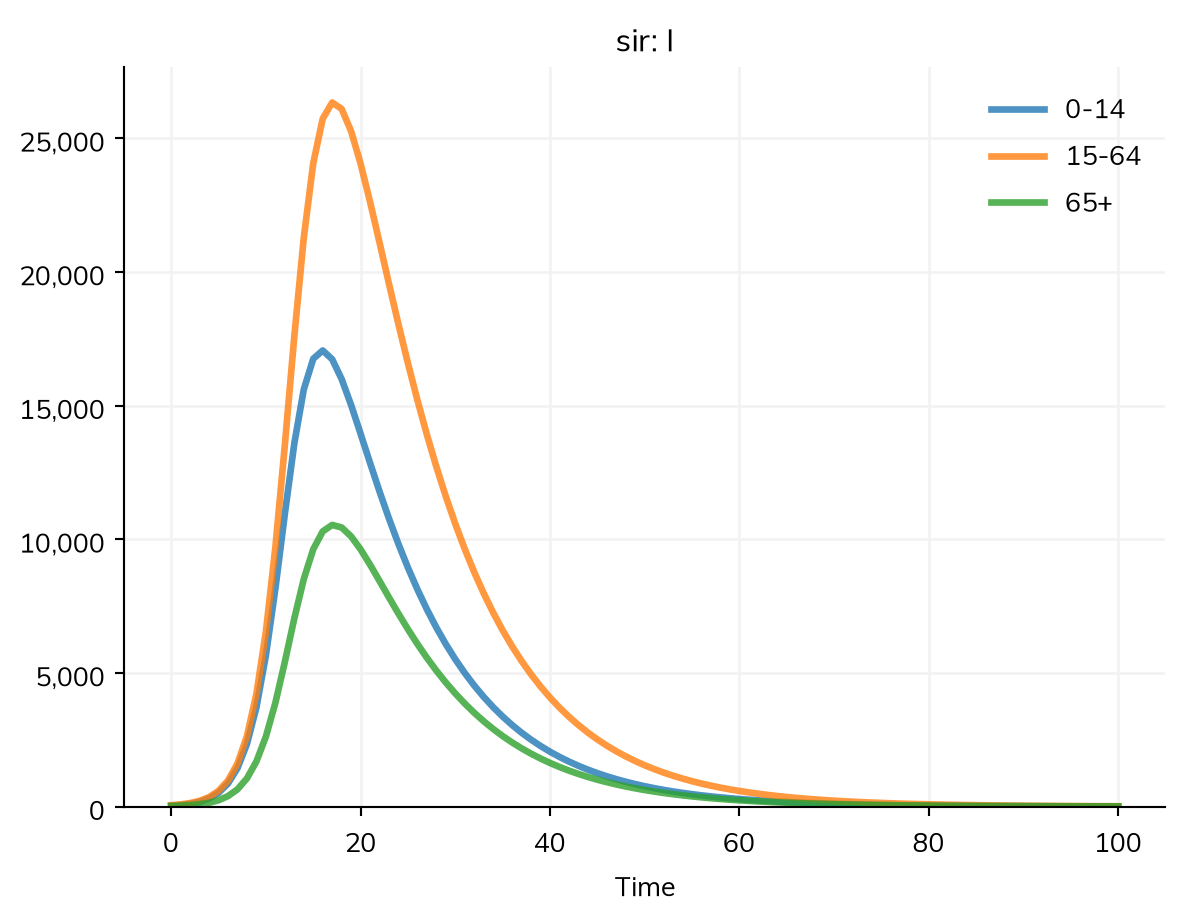
R0 is about 6, set by the largest eigenvalue of the matrix of contacts weighted by β and the infectious period, not by any one group’s contacts. Children, who have the most contacts, drive the epidemic, but with an R0 this high, it reaches almost everyone in every age group. The total infected in each age group:
sim.results.sir.infection.by('age').summarize()0-14 29953.119963
15-64 49742.041450
65+ 19896.816580
Name: infection, dtype: float64Of 30,000 children, 50,000 adults under 65, and 20,000 people aged 65 and over, these are all but a few hundred in each group.
Advanced: a real population, with contacts by setting
This part is an extension of the example above, with a larger model. Closing schools is one of the first measures considered against a new respiratory infection. It removes the contacts children make at school, but not those at home or elsewhere, so whether it helps depends on how much of the spread happens at school, and on when the schools close and reopen. A model of it needs contacts by setting. This part adapts the school closure example of the Epidemics R package: an SEIR model of an influenza-like infection in the population of the United Kingdom, in three age groups, with the contact matrices of Prem et al. (2021) for each setting.
| Parameter | Value | Meaning |
|---|---|---|
| β | 0.016 per contact | Rate of infection per contact with an infectious person |
| Latent period | 3 days | Mean time in E (exponential) |
| Infectious period | 7 days | Mean time in I (exponential) |
| Age groups | 0–19, 20–39, 40+ | With the fractions of the United Kingdom’s population |
| Contacts | Prem et al. (2021) | One matrix each for home, school, work, and the rest of the community |
| Infectious at the start | One in a million | |
| Closure | Days 200 to 260 | School contacts removed; the others go on |
Rather than writing the fractions of each age group and the matrix by hand, ss.population() gives the country’s population by age, and ss.contacts() its matrix for each setting, for the age groups of the model:
S, E, I, R = ss.states('S E I R')
flu = ss.Disease(
    infection = S >> E @ 0.016*I,
    onset     = E >> I @ ss.days(3),
    recovery  = I >> R @ ss.days(7),
    init      = dict(I=1e-6),
    name      = 'flu',
)
flu.stratify(age=[0, 20, 40])

home, school, work, community = [ss.contacts('United Kingdom', layer=layer) for layer in ['home', 'school', 'work', 'community']]
R0 is about 1.5.
Closing schools
The closure is a modifier of the school contacts: from day 200 to day 260 they are multiplied by zero, and when it ends, they are back as they were, since a modifier never changes the contacts themselves.
closure = ss.modify(school, multiply=0, start=ss.days(200), stop=ss.days(260))pars = dict(people=ss.population('United Kingdom'), networks=[home, school, work, community], stop=ss.days(600))
sims = {
'Schools open': ss.Sim(flu, **pars),
'Schools closed for 60 days': ss.Sim(flu, interventions=closure, **pars),
}
msim = ss.parallel(sims)
msim.plot('flu_I')MultiSim: 2 runs of 2 scenarios (Schools open, Schools closed for 60 days)
Done in 0.95 s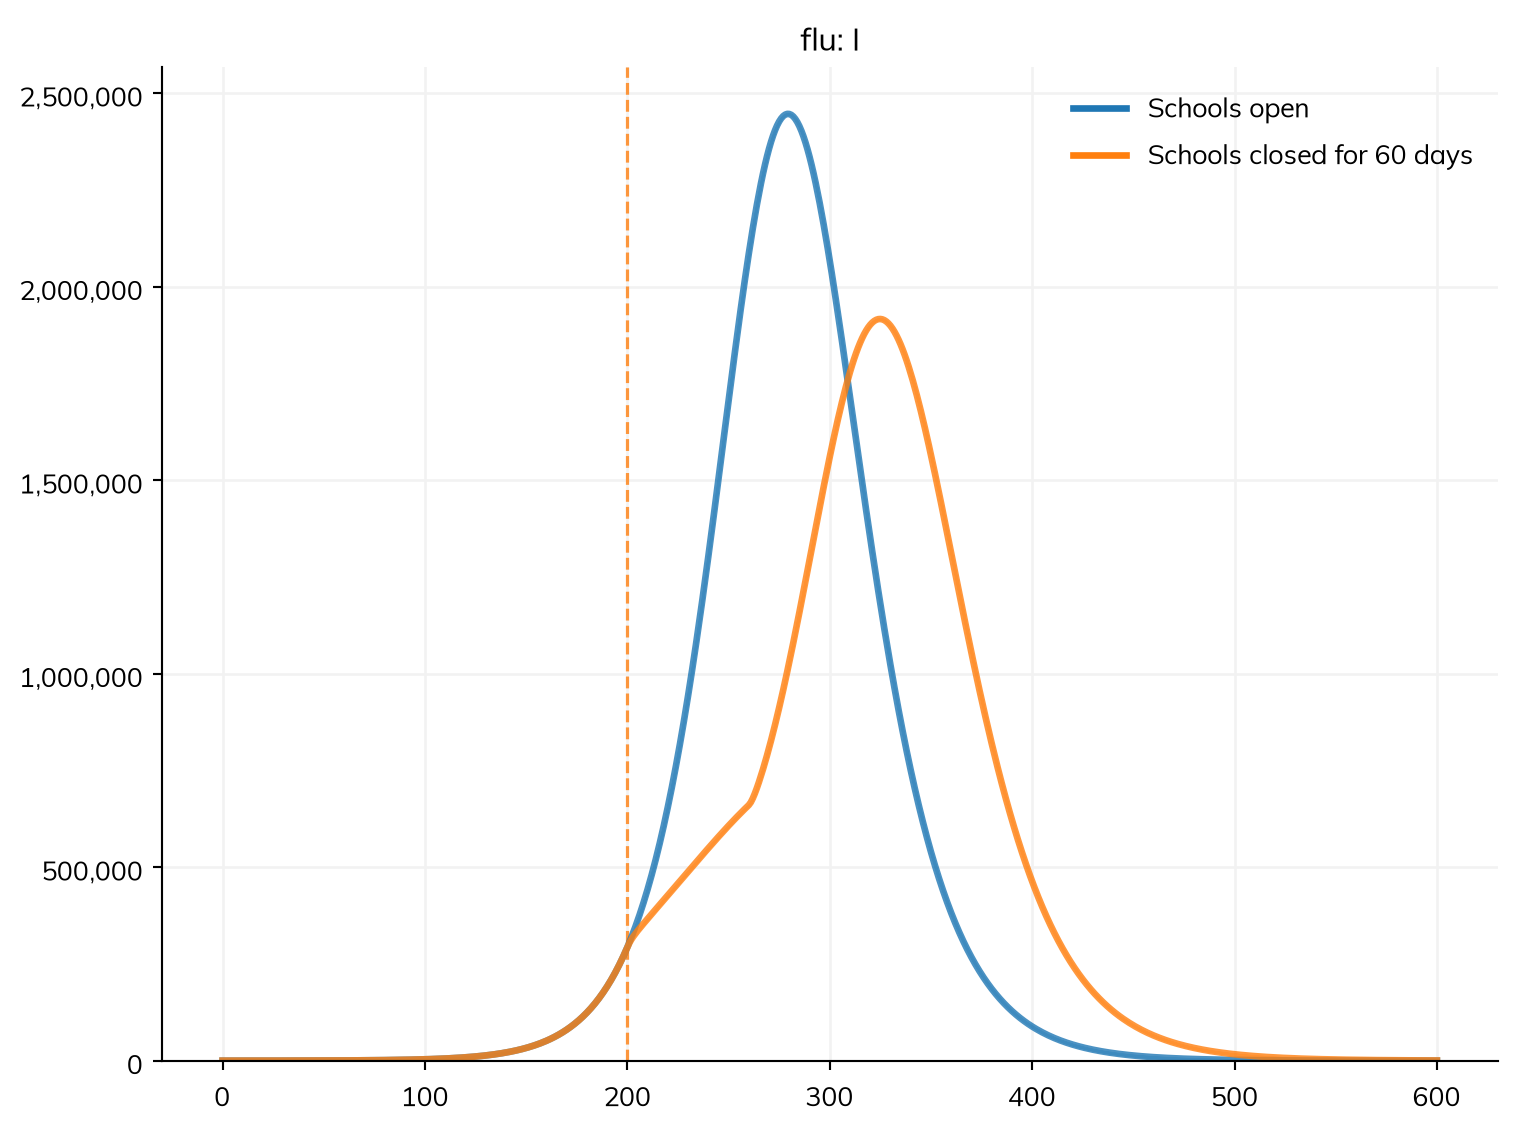
The closure doesn’t prevent the epidemic. It delays the peak by about six weeks and lowers it by about a fifth, which could matter for hospitals, but most of those it spares are infected after schools reopen, since the epidemic resumes among people who are still susceptible: the number infected in all is only about 3% lower.
msim.summarize().loc['flu_infection']| value | |
|---|---|
| scenario | |
| Schools open | 33,987,071 |
| Schools closed for 60 days | 32,886,651 |
By age, the number infectious falls in every group while schools are closed, and most among children, who make most of the contacts at school:
msim.sims['Schools closed for 60 days'].results.flu.I.by('age').plot() # The run sim, from the MultiSim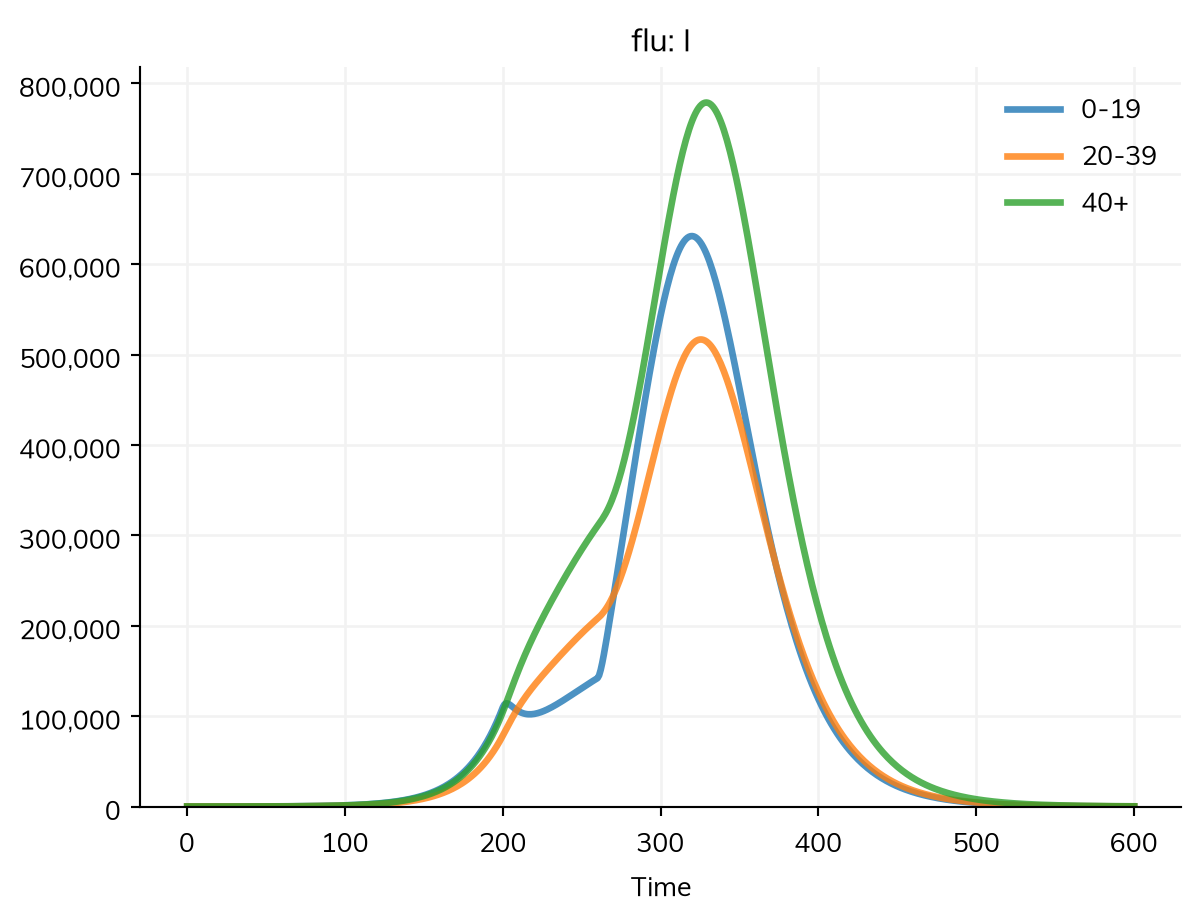
The Epidemics package says a closure another way: as a fraction by which the contacts of each age group fall (e.g. by half for those under 20). That works in Starsim too, as a modifier of each group’s susceptibility and transmissibility, e.g. ss.modify(flu.rel_sus, multiply=0.5, who=flu.age < 20, start=..., stop=...). Removing the school contacts says more directly what a closure does, when the contacts by setting are known.
Going further
- T4 – Mixing adds age groups and a contact matrix to the measles model, with data for real countries; T5 – Interventions and scenarios compares scenarios in it, including school terms.
- Stratification, Mixing, and Places and data cover the options, including the contact matrices by country and setting; Interventions covers
ss.modify(). - Epidemics: modeling non-pharmaceutical interventions, the original of the school closure example.
- Keeling MJ, Rohani P (2008). Modeling Infectious Diseases in Humans and Animals. Princeton University Press.
- Prem K, et al. (2021). Projecting contact matrices in 177 geographical regions. PLoS Computational Biology 17(7): e1009098.