People differ in ways that change how a disease spreads: children mix more than adults, some people are vaccinated, some take more risks. Stratifying a model divides its population into groups by such a property (age, sex, place, risk, vaccination), so that each group can have its own rates, contacts, and results. In Starsim this is one operation, stratify(), applied to a finished model: its states and transitions don’t change, and the property becomes a dimension of each. For a step-by-step introduction, see T4 – Mixing and T7 – Stratification and co-transmission.
Age groups and contacts
Here the measles model is stratified into three age groups, with the fraction of the population in each, and given a contact matrix: row i, column j is the number of contacts per day that a person in group i has with people in group j. 80% of children (0–14) start immune, 92% of adults (15–64), and 98% of people 65 and over:
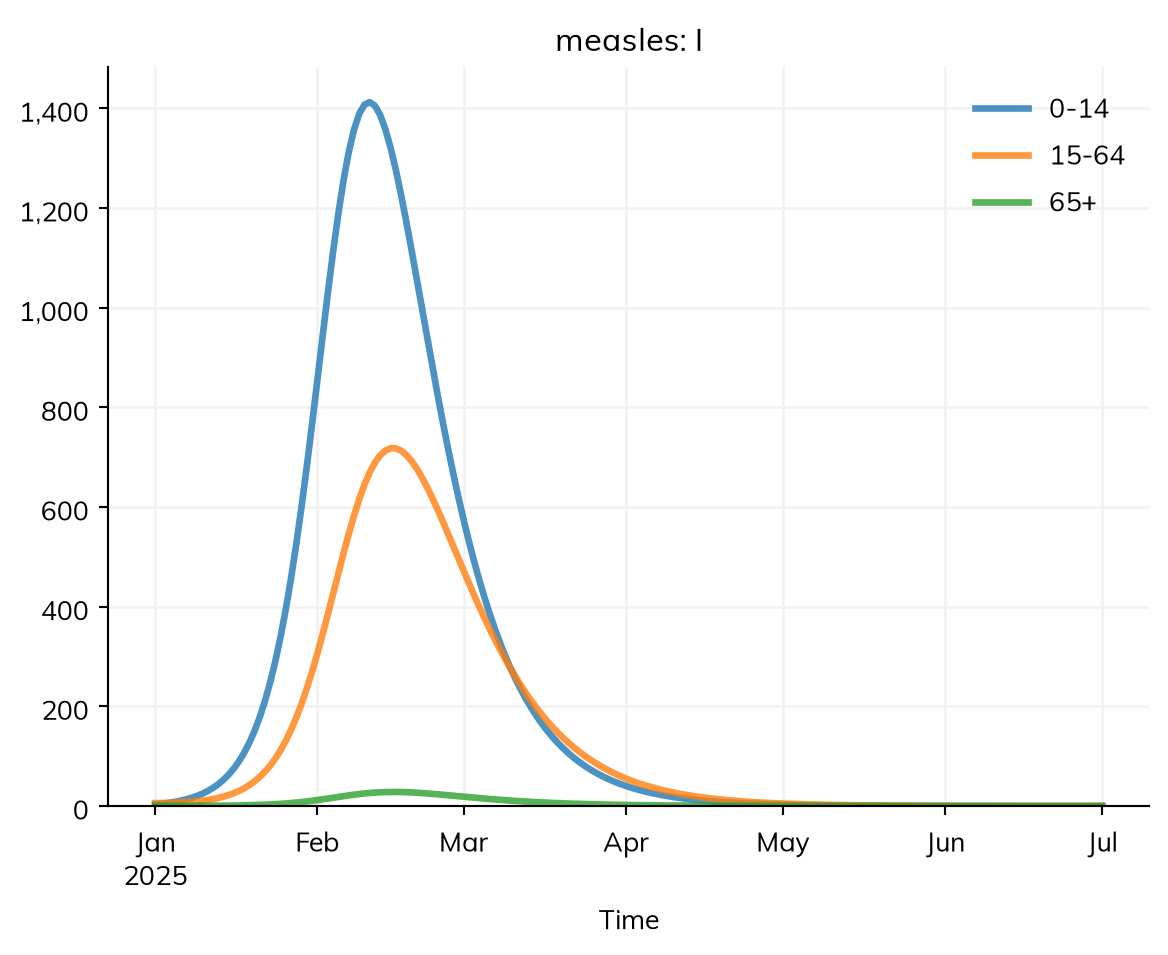
import starsim as ssS, I, R = ss.states('S I R')infection = S >> I @0.14*I # With contacts, beta is per contact: 0.14 per contact per dayrecovery = I >> R @ ss.days(8)measles = ss.Disease(infection, recovery, init=dict(R=ss.by(age=[0.8, 0.92, 0.98])), init_n=dict(I=10))measles.stratify(age={0: 0.3, 15: 0.6, 65: 0.1}) # Ages 0-14, 15-64, and 65+, with the fraction in eachcontacts = ss.contacts(ages=[0, 15, 65], matrix=[[10, 6, 1], [3, 8, 1], [3, 6, 3]])sim = ss.Sim(measles, networks=contacts, total_pop=100_000, start='2025-01-01', stop='2025-07-01')sim.run()res = sim.results.measlesfor age in ['0-14', '15-64', '65+']: infections = res.infection.select(age=age).sum()print('Aged', age, '-', round(infections), 'infections, or', round(infections / res.S.select(age=age)[0], 2), 'of those susceptible')res.I.by('age').plot()
Sim: measles, 100,000 people, as an ODE, 2025-01-01 to 2025-07-01
  measles: R0 = 15.8 (R = 2.46 at the start, with 11% susceptible), with 10 infectious at the start
  Done in 0.0037 s; measles: 8,795 infections; at most 2,122 infectious, on 2025-02-12
Aged 0-14 - 5461 infections, or 0.91 of those susceptible
Aged 15-64 - 3208 infections, or 0.67 of those susceptible
Aged 65+ - 127 infections, or 0.64 of those susceptible
library(starsim)states("S I R")measles <-Disease(infection =Transition(S, I, rate =0.14* I), # With contacts, beta is per contact: 0.14 per contact per dayrecovery =Transition(I, R, dur =days(8)),init =list(R = ss$by(age =c(0.8, 0.92, 0.98))),init_n =list(I =10))measles$stratify(age =list("0"=0.3, "15"=0.6, "65"=0.1)) # Ages 0-14, 15-64, and 65+, with the fraction in eachage_contacts <-contacts(ages =c(0, 15, 65), matrix =rbind(c(10, 6, 1), c(3, 8, 1), c(3, 6, 3)))sim <-Sim(measles, networks = age_contacts, total_pop =100000, start ="2025-01-01", stop ="2025-07-01")sim$run()res <- sim$results$measlesfor (age inc("0-14", "15-64", "65+")) { infections <-sum(res$infection$select(age = age)$values) susceptible <- res$S$select(age = age)$values[1]cat("Aged", age, "-", round(infections), "infections, or", round(infections / susceptible, 2), "of those susceptible\n")}res$I$by("age")$plot()
Each equation of the SIR model now holds for each age group, and transmission sums over the groups that each group meets:
sim.diseases.measles.equations()
dS/dt = -beta * S * I / N
dI/dt =  beta * S * I / N - I / dur_I
dR/dt =  I / dur_I

In each equation, a state is its number in each group of age (0-14, 15-64, 65+), and in a transmission, I / N in group i is
  the sum over groups j of C[i, j] * I[j] / N[j], with C the contacts per day of "contacts" (row i, people in group i; column j, their contacts in group j):
   0-14        10         6         1
  15-64         3         8         1
    65+         3         6         3
With contacts, β is the rate of infection per contact with an infectious person, and R0 depends on the whole contact matrix. Mixing covers contact matrices and what a matrix acts on, and Places and data those for real countries (ss.contacts('Kenya')). In short: with beta*I, as here, the fraction of each group who are infectious; with beta*I.n, their number; and with beta*I.frac, their number over everyone, as in Keeling & Rohani’s matrices.
Levels and fractions
The levels of a dimension are given as a list, or as a dict with the fraction of people in each:
If the fractions aren’t given, they come from the population where it has them (the ages of a named population such as ss.population('Kenya')), or else from the world’s population by age for age groups, everyone in the first level for true and false, and equal fractions otherwise, each marked as a guess by describe(). A level is referred to by its label ('0-14') or its position (0). Several dimensions can be given in one call, e.g. measles.stratify(age={0: 0.3, 15: 0.6, 65: 0.1}, risk={'low': 0.8, 'high': 0.2}).
The options that are needed less often go with the levels, in ss.levels() (listed in the appendix). What kind of dimension it is comes from its name and levels: age= with numbers is age groups (people age between them), a geography or mobility= makes places, and anything else is plain groups; ss.levels(..., kind='age'), 'space', or 'plain' says so instead.
Stratifying part of a model
By default, a dimension applies to every state of people, in every group. Two options of ss.levels() narrow it:
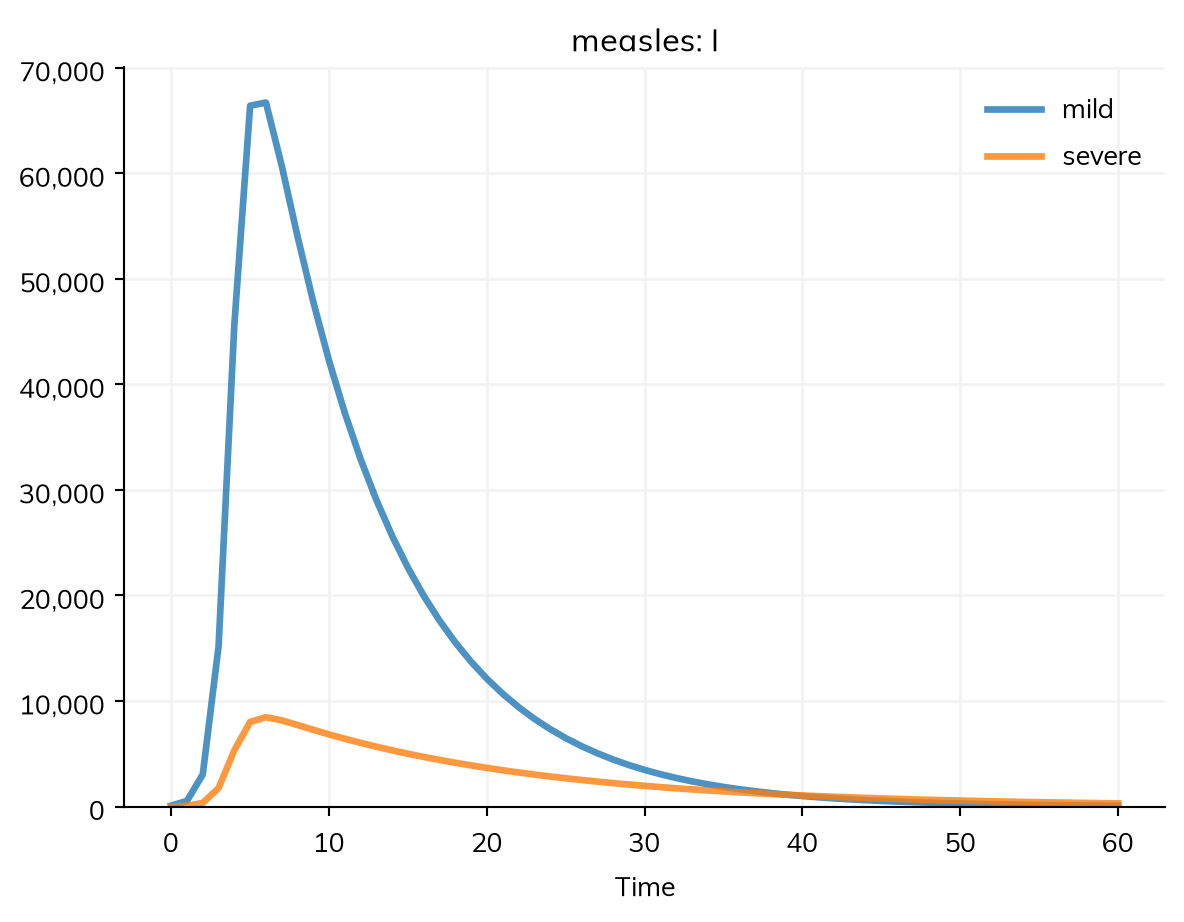
states= gives the states it applies to. Severity, for example, is a property of the infected only: people entering I take a level in proportion to the fractions.
who= gives the people it applies to, as a condition on the other dimensions: measles.stratify(sex=['female', 'male'], pregnant=ss.levels({False: 0.95, True: 0.05}, who=ss.person.female)) gives only women a level of pregnancy, so res.I.select(pregnant=True) counts women only. A condition can name levels (ss.person.risk == 'high'), the edges of age groups (ss.person.age >= 15), or several of these joined with &.
S, I, R = ss.states('S I R')infection = S >> I @1.9*Irecovery = I >> R @ (ss.days(8)*ss.by(severity=[1, 2])) # Severe cases last twice as longmeasles = ss.Disease(infection, recovery, init_prev=0.001)measles.stratify(severity=ss.levels({'mild': 0.9, 'severe': 0.1}, states=[I]))sim = ss.Sim(measles, total_pop=100_000, stop=ss.days(60), verbose=0)sim.run()sim.results.measles.I.by('severity').plot()
Stratifying the sim or a disease
Age, sex, and place are properties of people, and every disease in a sim has to agree on them, so a property of people is usually stratified once, on the sim, and every disease gets it: ss.Sim([measles, rubella], networks=contacts, stratify=dict(age=[0, 15, 65])). A dimension that belongs to one disease (vaccination against measles, or severity) is stratified on that disease; ss.Disease(..., stratify=dict(...)) is the same as calling stratify() on it. Stratifying by place, with movement between places, is covered in Places and data.
Compartments and agents
Run as compartments, each state has one compartment for each combination of levels: 3 age groups, 2 vaccination levels, and 3 states are 18 compartments. Run as agents, each person has their own value of the property, and the groups are used for the contacts, values by group, and results. A stratified model gives the same results by group either way. From declaration to run describes how a dimension is represented.
How groups differ
A stratified model is the same model in each group until something says otherwise, by contacts (a contact matrix by a dimension, as above) or by values by group.
Values by group
ss.by() gives a value for each level of one or more dimensions, by position or by label, wherever a value is used: in a rate, as a fraction, or as the coverage of an intervention:
beta = ss.by(age=[2.5, 1.9, 1.0]) # By positionbeta = ss.by(age={'0-14': 2.5, '15-64': 1.9, '65+': 1.0}) # By labelbeta = ss.by(age=[2.5, 1.9, 1.0], risk=[1.0, 3.0]) # One value per age group and risk level: the productinit = ss.by(age=[0.002, 0.001, 0]) # A fraction of each age group
A starting fraction, like init above, is of each group, not of everyone: 0.0001 of everyone infected, all in a high-risk group that is 20% of people, is init=dict(I=ss.by(risk=[0.0001/0.2, 0])). A table (a dataframe with a column for each dimension and a column value) gives each combination directly, and a table by single year of age works whatever the model’s age groups. A value for each group can itself change over time. See Parameters.
For a disease that is already written, ss.modify() multiplies one of its quantities by a value for each level: a transition’s rate (for a branch chosen with p=, its probability), or rel_sus and rel_trans, the susceptibility and infectiousness of the people in each group:
measles.stratify(age={0: 0.3, 15: 0.6, 65: 0.1}, risk={'low': 0.8, 'high': 0.2})slower = ss.modify(measles.recovery, multiply=ss.by(age=[1.0, 1.0, 0.8])) # Older people recover more slowlyriskier = ss.modify(measles.rel_sus, multiply=ss.by(risk=[1, 3])) # High-risk people are 3 times as susceptiblesim = ss.Sim(measles, connectors=[slower, riskier])
Several dimensions
A model can be stratified by several properties, in one call or several. Here 90% of people are vaccinated, with a vaccine that is 97% protective, as a second dimension with susceptibility by level. The “Explicit” tab gives each dimension with ss.levels() and the kind that Starsim takes from its name and levels:
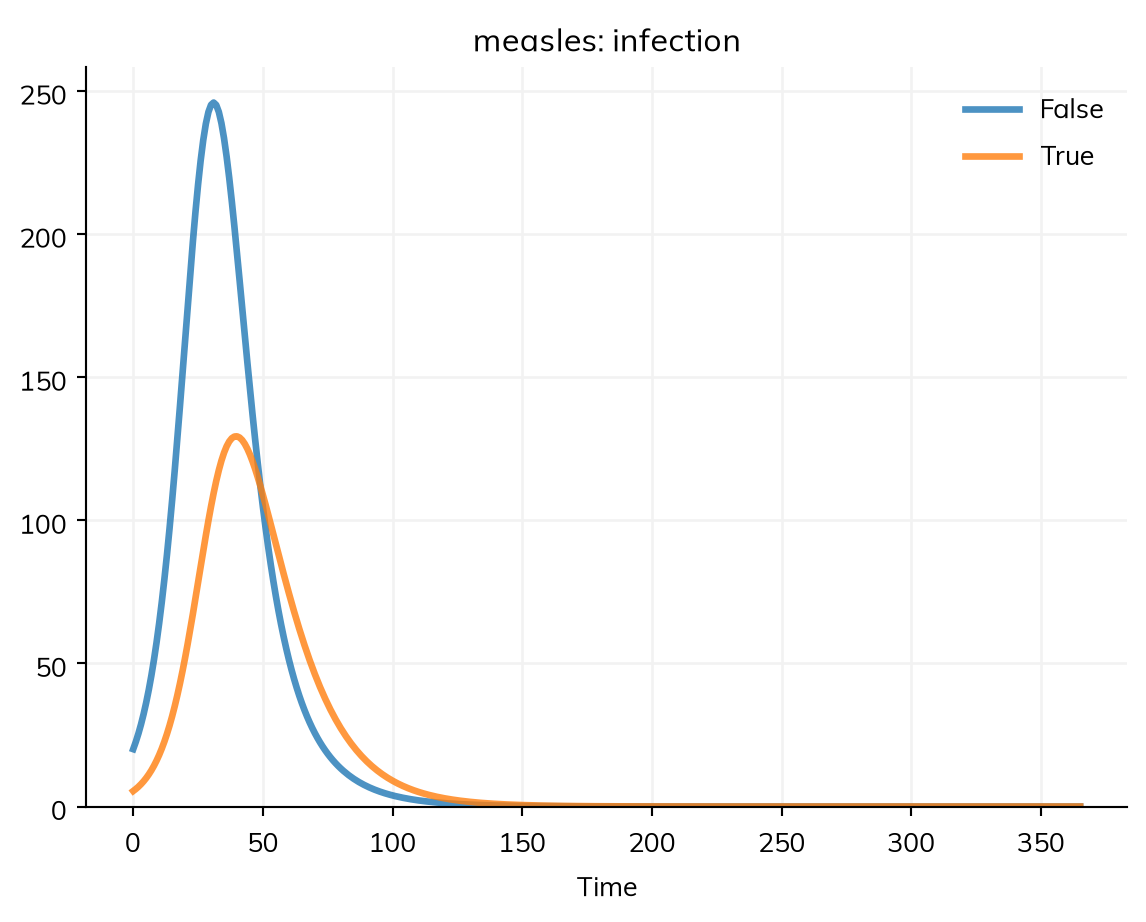
defmake_measles(vaccinated): S, I, R = ss.states('S I R') beta =0.14*ss.by(vaccinated=[1, 0.03]) if vaccinated else0.14# The vaccinated are 3% as susceptible infection = S >> I @ beta*I recovery = I >> R @ ss.days(8) measles = ss.Disease(infection, recovery, init_prev=0.001, name='measles') measles.stratify(age={0: 0.3, 15: 0.6, 65: 0.1})if vaccinated: measles.stratify(vaccinated={False: 0.1, True: 0.9})return measlesbase = ss.Sim(make_measles(False), networks=contacts, total_pop=100_000, stop=ss.days(365), verbose=0)base.run()sim = ss.Sim(make_measles(True), networks=contacts, total_pop=100_000, stop=ss.days(365), verbose=0)sim.run()res = sim.results.measlesprint('Infections with no vaccination:', round(base.results.measles.infection.sum()))print('Infections with 90% vaccinated:', round(res.infection.sum()))print('Among the vaccinated:', round(res.infection.select(vaccinated=True).sum()))print('Among unvaccinated children:', round(res.infection.select(age='0-14', vaccinated=False).sum()))res.infection.by('vaccinated').plot()
Infections with no vaccination: 99900
Infections with 90% vaccinated: 14909
Among the vaccinated: 6013
Among unvaccinated children: 2855
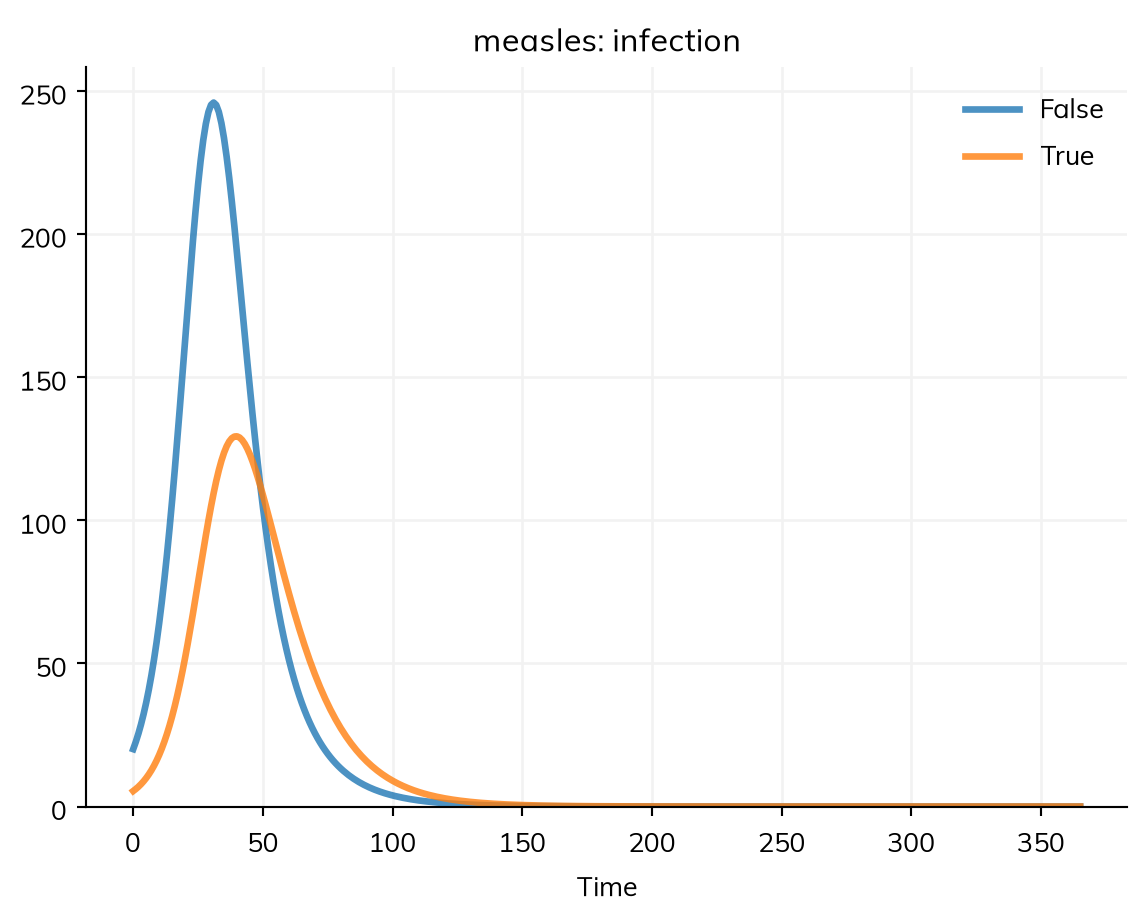
defmake_measles_explicit(vaccinated): S, I, R = ss.states('S I R') beta =0.14*ss.by(vaccinated=[1, 0.03]) if vaccinated else0.14# The vaccinated are 3% as susceptible infection = S >> I @ beta*I recovery = I >> R @ ss.days(8) measles = ss.Disease(infection, recovery, init_prev=0.001, name='measles') measles.stratify(age=ss.levels({0: 0.3, 15: 0.6, 65: 0.1}, kind='age')) # Age groups, which people age throughif vaccinated: measles.stratify(vaccinated=ss.levels({False: 0.1, True: 0.9}, kind='plain')) # Plain groups, which people stay inreturn measlessim = ss.Sim(make_measles_explicit(True), networks=contacts, total_pop=100_000, stop=ss.days(365), verbose=0)sim.run()sim.results.measles.infection.by('vaccinated').plot()
sim.describe() lists each dimension with its levels and fractions, and each rate with its values by group. A fraction given for each level of a dimension applies within each level of the others: here 90% of each age group is vaccinated; fractions that differ by age are an ss.by() over both dimensions.
Mixing is a separate decision. Stratifying doesn’t by itself say who meets whom: without a contact matrix, people in every group mix at random, in proportion to their numbers. With several dimensions, each with its own matrix, contacts are assumed to be separable (age and risk affect contacts independently); when they aren’t, give a joint matrix. Likewise, fractions given separately for two dimensions assume that they are independent; when they aren’t, give fractions with ss.by() over both.
Moving between groups
People can move between the levels of a dimension, without changing their disease state:
Aging. In a model with births or deaths, people move up the age groups as they get older, at the rate the age groups give. A closed population (with no births or deaths) doesn’t age, since its age groups would empty, and describe() says so; aging=True on the sim ages it anyway.
Transfers.ss.transfer() moves people between levels at a rate: ss.transfer(dict(vaccinated=True), rate=ss.peryear(0.2)) vaccinates the unvaccinated at a rate of 0.2 per year, whatever their disease state (so about 18% of them in a year, 1 − exp(−0.2), not 20%; for 20% a year, give ss.prob(0.2, 'year')), and ss.transfer(dict(risk=('low', 'high')), rate=ss.peryear(0.1)) moves people from low to high risk. A transfer is given to stratify() by keyword, and has a result of its own, as a transition does:
Counters.increment= on a transition moves people up a dimension of whole numbers each time it happens to them, e.g. the number of infections, doses, or births. A rate reads each person’s count as a property of people, ss.person.infections (in a compartmental run, each level’s count), e.g. a susceptibility that falls with each past infection:
S, I = ss.states('S I')tppi = ss.par(0.5) # Protection per past infectioninfection = ss.Transition(S, I, rate=(1- tppi)**ss.person.infections*ss.perday(0.3)*I, increment='infections')sis = ss.Disease(infection, I >> S @ ss.days(7), init=dict(I=0.01), name='sis')sis.stratify(infections=[0, 1, 2, 3, 4]) # 0, 1, 2, 3, 4+
Interventions. A delivery can move people between levels too, e.g. to vaccinate them on a date (Products).
A stratified result is still one result: used as it is, it is the total over every group. select() picks groups, and by() gives one series per level of a dimension:
res = sim.results.measlesres.I # Everyone in Ires.I.select(age='0-14') # Children in I (or age=0, by position)res.I.select(age=0, vaccinated=True) # Vaccinated children in Ires.I.select(age=[1, 2]) # Everyone 15 and over in I: the levels listed are added up, as one seriesres.infection.by('age') # New infections, one series per age group
A list of levels gives their total, so coarser groups don’t need a model stratified more coarsely. A ratio, such as prevalence, is never averaged over groups: its numerator and denominator are each summed over the groups selected, and then divided. See Results.
Pitfalls and further reading
stratify() changes the model it is called on, and returns it. To keep the original as well, use inplace=False, which returns a stratified copy. Running the same cell twice in a notebook is safe: stratifying again in the same way does nothing, with a note. Stratifying by a dimension the model already has, in another way, is an error; build the model again.
Contacts by other age groups. A contact matrix by age groups that differ from the model’s is converted to the model’s, with a note. Check it in describe().
R0 without the contacts.measles.R0() on the disease alone assumes homogeneous mixing; sim.diseases.measles.R0() uses the sim’s contacts and groups.
A closed population doesn’t age. Over a long run without births or deaths, the age groups stay as they started.
socialmixr: contact matrices from social contact surveys, in R
summer2: compartmental models in Python, stratified by repeatedly splitting compartments, much as stratify() does
epydemix: age-structured compartmental models with contact matrices for many countries
Appendix: every option of a stratification
stratify() on a disease (and stratify=dict(...) on a sim or a disease) takes each dimension by keyword, with its levels (see Levels and fractions) or a geography (patch=ss.geo.geography(...)), inplace=False to return a stratified copy, and a transfer by keyword (Moving between groups). See ss.Disease.stratify for the details. The levels can be given with these options, as ss.levels(levels, ...):
Option
What it gives
states
The states it applies to (by default, every state of people), e.g. states=[I] for severity
who
The people it applies to, as a condition on the other dimensions, e.g. who=ss.person.female; others have no level of it
kind
'age', 'space', or 'plain', if not as its name and levels say
Fractions that depend on the levels of other dimensions, as an ss.by() over both, e.g. a fraction severe by age
Names that mean something
Most dimensions are plain groups, whatever they are called (risk, vaccinated, severity). These names, and these ways of making a dimension, mean something more:
Name or form
What it means
age, with numbers
Age groups: people age between them (in a model with births or deaths), a contact matrix by age is converted to them, and the fractions come from a named population or the world’s ages
sex
People’s sex (ss.person.female as agents): two levels, one of them 'female' (e.g. sex=['female', 'male'])
A geography, or ss.levels(..., mobility=...)
Places (kind='space'), with movement between them; see Places and data
patch, region, district, county, province, place, location, with only names
Plain groups that mix as one population, with a note, since a list of names alone gives no movement; give a geography or ss.levels(..., mobility=...) for places