What a model tracks is not what is observed: a model of measles tracks who is susceptible, latent, infectious, and immune, while surveillance sees some of the cases, some days after infection. This page covers declaring more results (such as prevalence), declaring outcomes (reported quantities worked out from the model’s flows: cases, hospital admissions, deaths), and attaching data to results by name, so that it can be plotted and fitted. For a step-by-step introduction, see T6 – Data and calibration.
Declaring more results
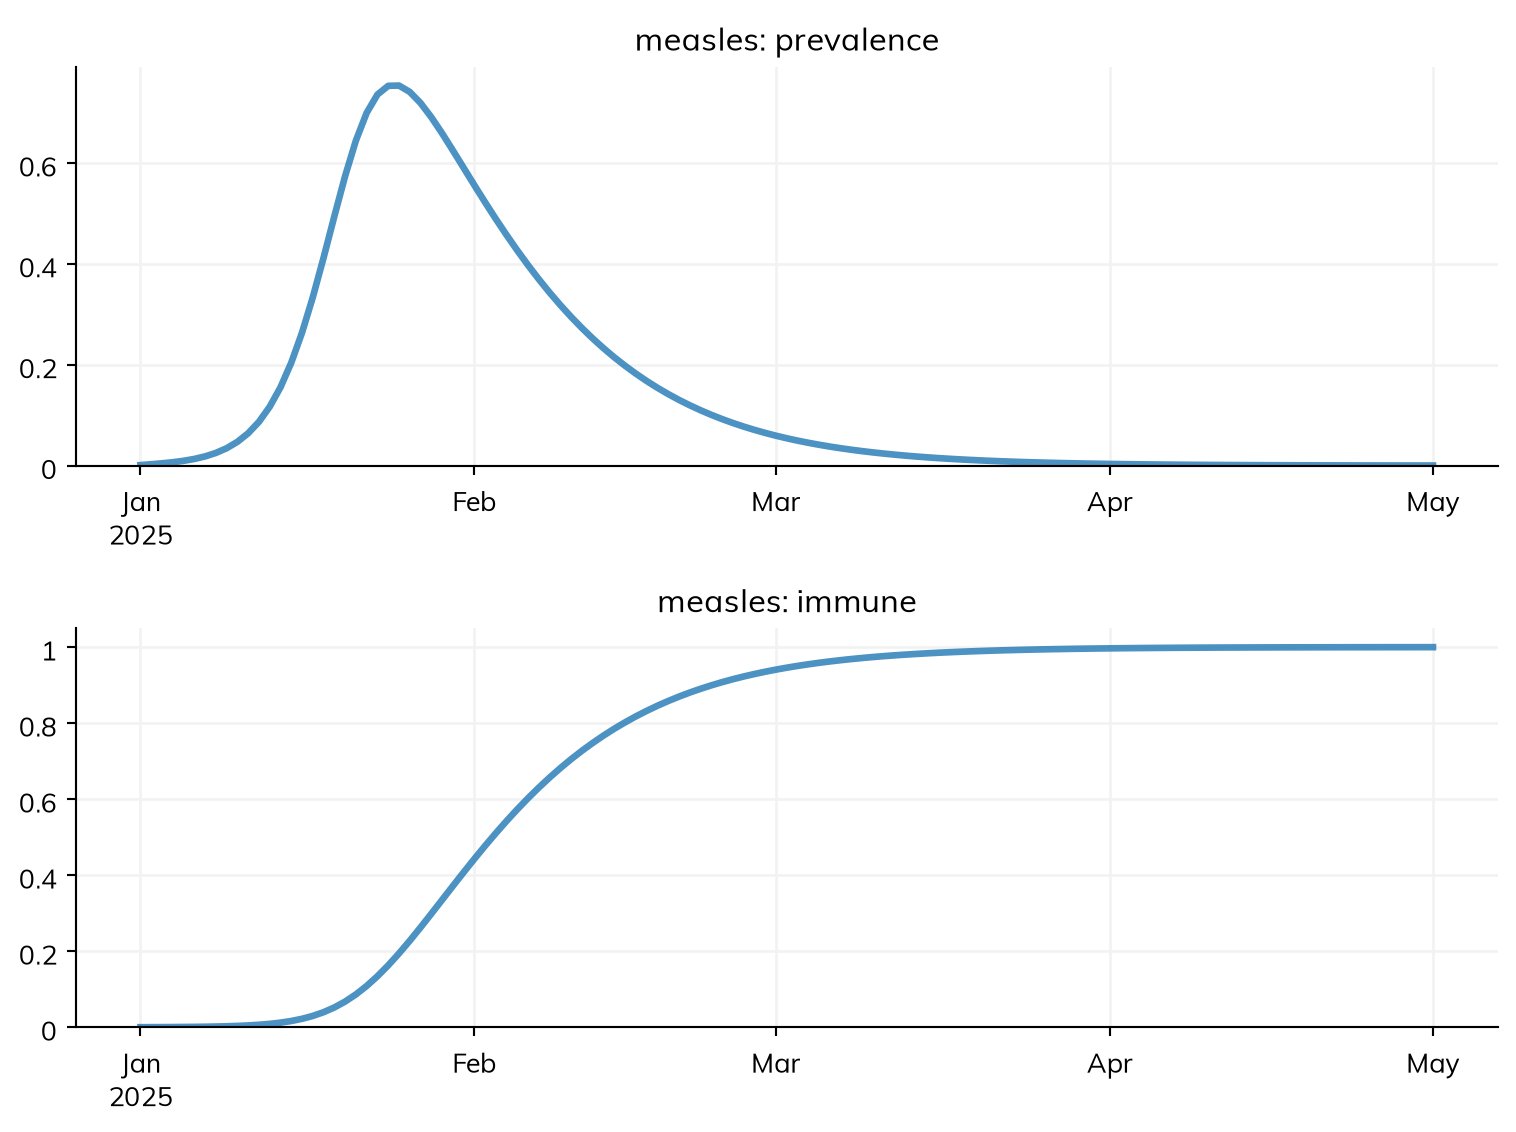
Every declared disease already has a result for each state (a stock: the number in it at each time point) and each transition (a flow: the number who made it during each step), named after it; see Results for working with them. A sum or ratio of states, given to the disease, is a result like any other. Nobody is “in” a sum of states, so it makes no new state; as a result, it is the combined count, and a ratio of two is a proportion:
import starsim as ssS, E, I, R = ss.states('S E I R')N = S + E + I + Rinfection = S >> E @1.9*Ionset = E >> I @ ss.days(10)recovery = I >> R @ ss.days(8)prevalence = (E + I)/N # The fraction of people infected, latent or infectiousimmune = R/N # The fraction immune, as a serosurvey would measure itmeasles = ss.Disease(infection, onset, recovery, prevalence, immune, init=dict(I=0.001))sim = ss.Sim(measles, total_pop=100_000, start='2025-01-01', stop='2025-05-01', verbose=0)sim.run()sim.diseases.measles.plot('prevalence', 'immune')
In rates and conditions, a state gives its number and fraction directly: I.n is the number in I, and I.frac the fraction of people in it. Flows can be used the same way: infection/S is the incidence per susceptible person. A ratio is a ratio of sums: by group or over a longer period, its numerator and denominator are each summed, and then divided, never averaged.
A result needs a name of its own. A parameter over time is a result of an expression of it under another name, eir_now = 1*eir; giving the parameter itself (eir=eir) raises an error. In a class, an expression with a value for each person, such as age = ss.person.age or duration = affected.time_in, is a helper for the rates, not a result.
Outcomes
An outcome is a reported quantity: a flow worked out from the model’s other flows, which moves nobody. It is how a model says what a surveillance system would see. For measles, the rash appears about 4 days after people become infectious, and suppose half of cases are reported, a tenth of reported cases are admitted to hospital (for 5 days on average), and 2% of those admitted die:
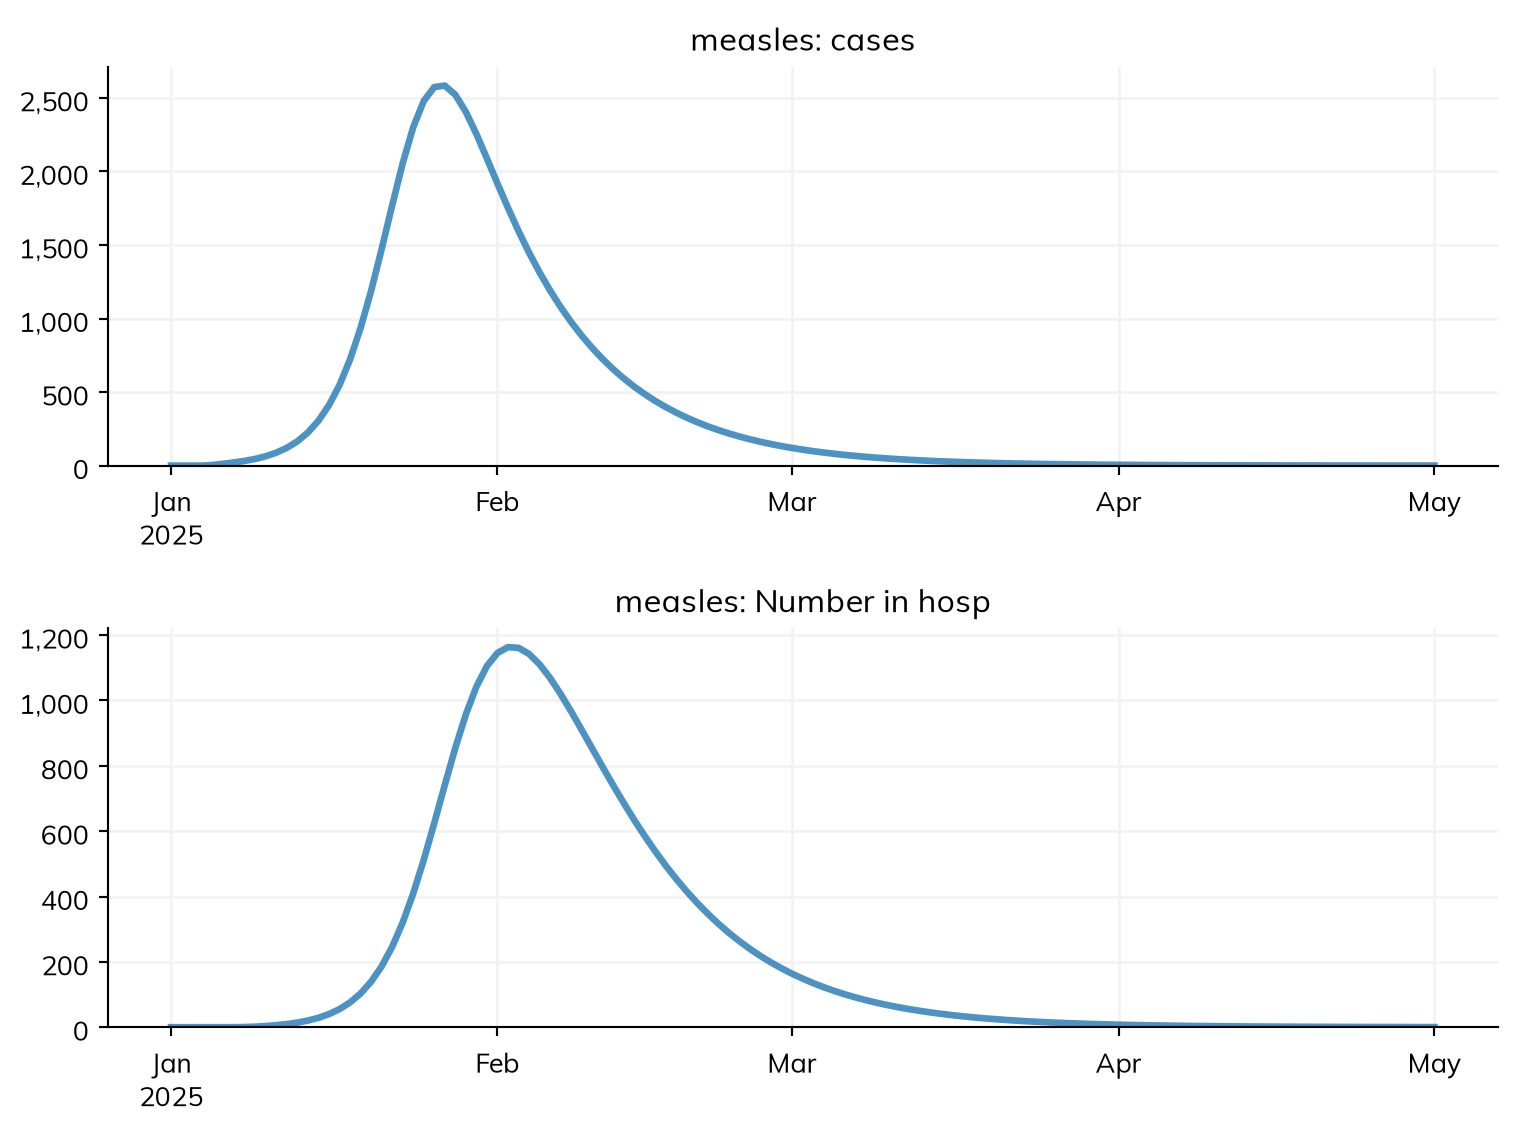
S, E, I, R = ss.states('S E I R')infection = S >> E @1.9*Ionset = E >> I @ ss.days(10)recovery = I >> R @ ss.days(8)cases = ss.outcome(0.5*onset, delay=ss.days(4)) # Half of cases reported, at the rashhosp = ss.outcome(0.1*cases, delay=ss.days(2), dur=ss.days(5)) # A tenth of those admitted to hospitaldeaths = ss.outcome(0.02*hosp, delay=ss.days(5)) # 2% of those admitted diemeasles = ss.Disease(infection, onset, recovery, cases, hosp, deaths, init=dict(I=0.001))sim = ss.Sim(measles, total_pop=100_000, start='2025-01-01', stop='2025-05-01', verbose=0)sim.run()res = sim.results.measlesprint('Reported cases:', round(res.cases.sum()))print('Hospital admissions:', round(res.hosp.sum()))print('Most in hospital at once:', round(res.n_hosp.max()))print('Deaths:', round(res.deaths.sum()))sim.diseases.measles.plot('cases', 'n_hosp')
Reported cases: 49947
Hospital admissions: 4995
Most in hospital at once: 1163
Deaths: 100
library(starsim)states("S E I R")infection <-Transition(S, E, rate =1.9* I)onset <-Transition(E, I, dur =days(10))recovery <-Transition(I, R, dur =days(8))cases <-outcome(0.5* onset, delay =days(4)) # Half of cases reported, at the rashhosp <-outcome(0.1* cases, delay =days(2), dur =days(5)) # A tenth of those admitted to hospitaldeaths <-outcome(0.02* hosp, delay =days(5)) # 2% of those admitted diemeasles <-Disease(infection = infection, onset = onset, recovery = recovery,cases = cases, hosp = hosp, deaths = deaths,init =list(I =0.001))sim <-Sim(measles, total_pop =100000, start ="2025-01-01", stop ="2025-05-01", verbose =0)sim$run()res <- sim$results$measlescat("Reported cases:", round(sum(res$cases$values)), "\n")cat("Hospital admissions:", round(sum(res$hosp$values)), "\n")cat("Most in hospital at once:", round(max(res$n_hosp$values)), "\n")cat("Deaths:", round(sum(res$deaths$values)), "\n")sim$diseases$measles$plot("cases", "n_hosp")
The source is a fraction of a flow, or a sum of fractions of several: 0.5*onset is half of those who become infectious. The fraction is the probability of being counted. Reporting that depends on severity is a sum: ss.outcome(0.1*mild + 0.6*severe), where mild and severe are transitions.
Outcomes can follow from outcomes: hosp is a fraction of cases, and deaths a fraction of hosp, so a chain of events is a line for each.
delay= is the time from the source event to this one: a duration (exponentially distributed, as for any duration), a distribution such as ss.constant(ss.days(4)) or ss.lognormal(...), or a function of the sim.
dur= is how long each event counted stays in the outcome (here, a stay in hospital), and gives a second result, n_<name>: the number currently in it, here the number in hospital.
A fraction can be a parameter: ss.par(0.5, bounds=[0.1, 0.9]) makes the reporting rate fittable, and ss.by(age=[...]) gives a fraction for each age group, as for any value (Parameters).
An outcome is worked out from the counts of its source flows, in each group, so it never records which people were counted. In a deterministic run, the fraction multiplies the flow and the delay spreads it over the following steps; in a stochastic or agent-based run, those counted are a binomial draw, and their delays are drawn too. Define what the data measures (cases dated by onset, or by report) before choosing the source and delay, and note that a delay moves events past the end of the run, so the last weeks of an outcome are lower than they will be.
describe() gives each outcome’s definition, under the disease’s transitions, e.g. cases outcome: 0.5 × onset, after 4 days (exponential).
An outcome, an intervention, or a state
An outcome stands for an observation process that the model doesn’t represent. Which to use depends on what the model contains:
The situation
Use
Testing and reporting aren’t in the model: “about half of cases are reported, four days after onset”
An outcome
Testing is modeled, by interventions
The interventions’ own results: each test reports the diagnoses it made (Products)
Being counted changes what happens to the person (people in hospital are isolated and stop transmitting)
An outcome is a result, so anything can read it: an intervention can be triggered when n_hosp passes a threshold. What it can’t do is single out individuals. An outcome belongs to one disease; a total over several diseases is arithmetic on their results after the run (sim.results.measles.cases + sim.results.rubella.cases), which is a result but not a declared one, so data can’t be attached to it.
Data attached by name
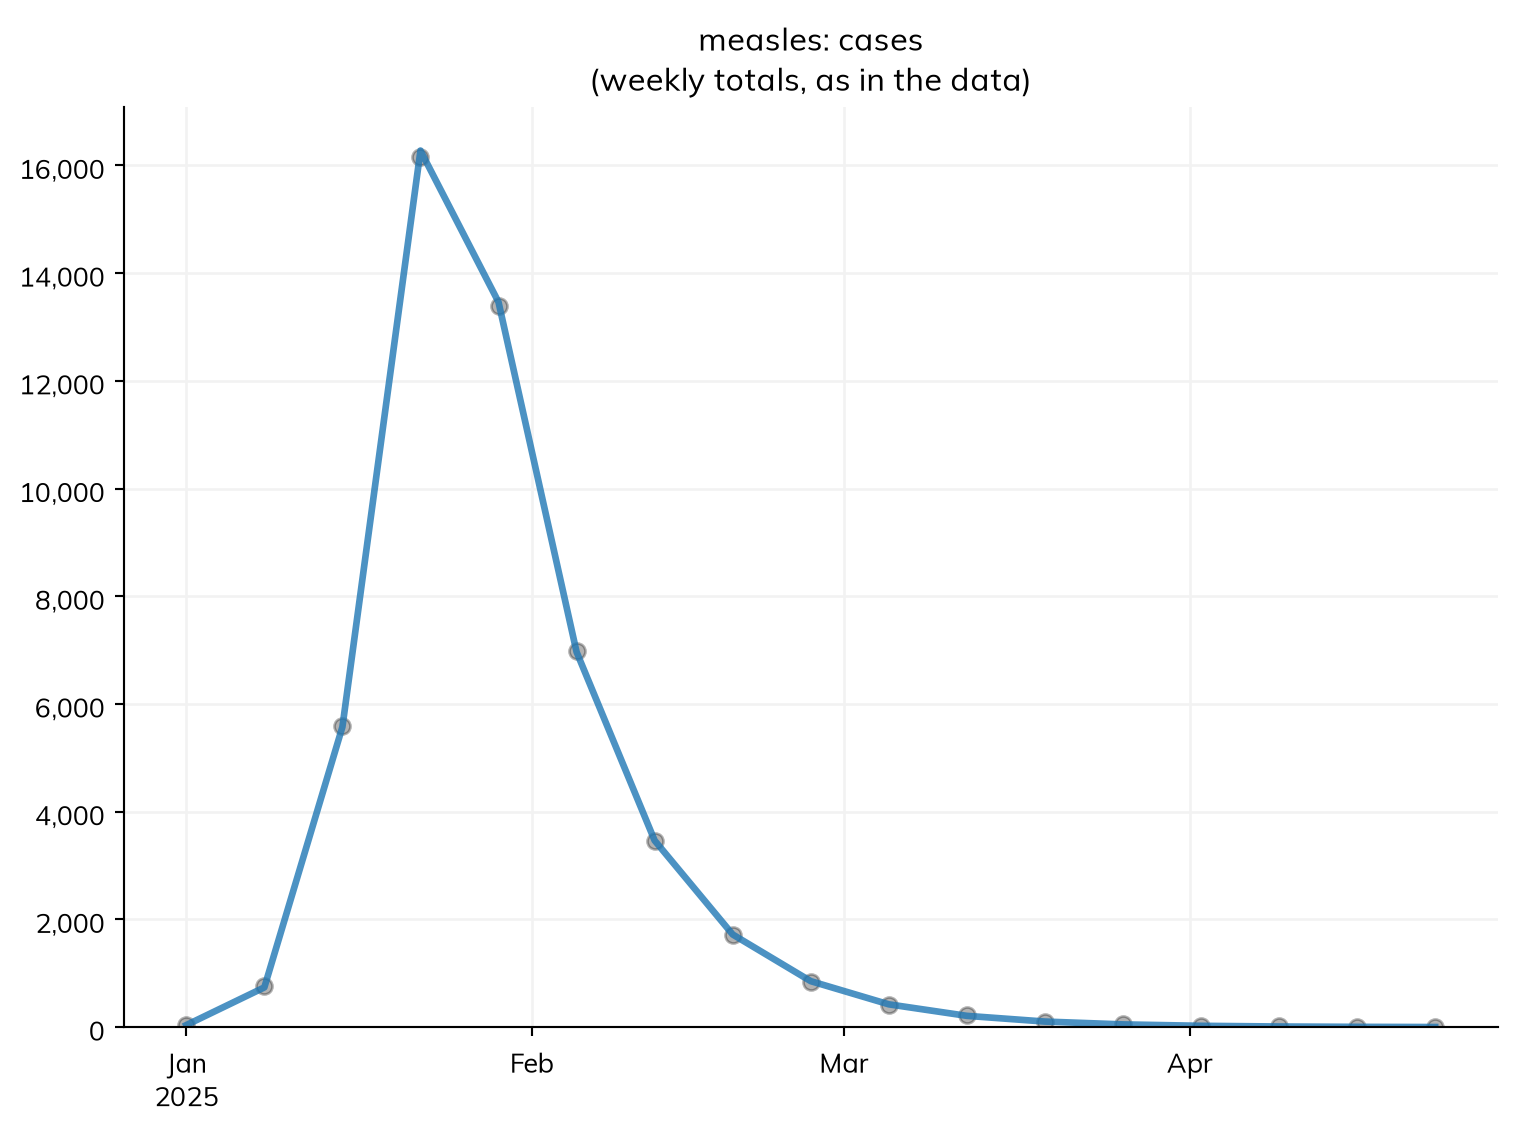
Data is attached to a sim with data=: a table with a time column (date, year, t, or time) and a column for each result there is data for, named like the result. A column called cases is compared with the result cases, and plotted with it. To try this where the answer is known, make data from the model: to_synthetic_data() draws weekly counts of reported cases from a run, with Poisson noise as in real reporting (noise=None gives the model’s values themselves), from a sim with its own random seed:
The plot shows the model’s cases summed over each week of the data, as they are compared in a fit, and its title says so.
Data need not be on the model’s time step. A flow, such as weekly reported cases, is compared with the model’s total over each week of the data, from the data’s date to the next (so a week is dated by its first day); a stock or a ratio, such as the fraction immune in a serosurvey, with the model’s value on the date of the data. The result already knows which it is.
With several diseases, a column is matched to the one that has a result of that name, or is named with its disease, measles.cases.
Data by group is given in long form: extra columns named after dimensions (age) say which group each row is for, and each row is compared with cases.select(age=...).
A missing value is not a zero. Leave weeks with no report empty (NaN) rather than 0, so that they are left out of the comparison rather than compared with a count of none.
A column that matches no result gets a note that lists the closest names, so a misspelled header is noticed; in a fit, it is an error.
Data is usually read from a file: data='measles_cases.csv' reads it. A file whose headers are not the names of results is read with ss.SimData(), which renames the columns and can drop those that match nothing:
Data attached this way is what calibration fits to: sim.fit() fits every parameter that has bounds to every result that has data.
Likelihoods
Nothing needs a likelihood to be compared with data or fitted to it: by default, a fit compares each result with its data by their normalized absolute difference, and sim.fit(loss=...) takes another measure, or a function of your own (Measuring the fit); a fit uses likelihoods for every data series or for none, so loss= with an outcome that has a likelihood is an error. Where a likelihood is wanted, for example for Bayesian methods, it is given with the outcome, as the distribution of the data around the model’s value:
The model’s value is the mean of the distribution, and the rest (here the dispersion of a negative binomial) is given, or fitted as a parameter. Use ss.poisson() for counts with no more spread than chance gives, ss.nbinom() for overdispersed counts (most surveillance data), and ss.binom() for the positives among those tested; Fitting a model lists every likelihood and the data each suits.
Pitfalls and further reading
A daily result against weekly data. Compare like with like: res.cases.resample('week') is the model’s weekly cases.
An outcome where a state is needed. If being counted changes what happens to a person, it is a state, not an outcome.
A misspelled data column. A column that matches no result is only noted when the sim is made; read the notes, or use ss.SimData(..., aliases=...) to rename it.
Further reading:
EpiNow2: estimating epidemic growth from delayed and partly reported cases, with delay distributions, in R