import starsim as ssSolutions: T1 – Getting started
These are solutions to the exercises at the end of T1 – Getting started. Many of the exercises are open-ended, so these are examples: there are often other good answers. This page runs on its own, from the setup below.
Exercise 1
Suppose people with measles were infectious for only 5 days, with the same β. What would R0 be? Change the model, run it, and check the R0 the run prints. How does the epidemic change?
R0 = β × the infectious period (β/γ) = 1.9 × 5 = 9.5, as R0() confirms. People recover sooner, so fewer are infectious at once and the peak is lower; but with R0 still well above 5, almost everyone is infected.
S, I, R = ss.states('S I R')
infection = S >> I @ 1.9*I
recovery8 = I >> R @ ss.days(8) # Infectious for 8 days, as in the tutorial
recovery5 = I >> R @ ss.days(5) # Infectious for 5 days instead
measles8 = ss.Disease(infection, recovery8, init_prev=0.001, name='measles')
measles5 = ss.Disease(infection, recovery5, init_prev=0.001, name='measles')

sim8 = ss.Sim(measles8, total_pop=100_000, stop=ss.days(50))
sim5 = ss.Sim(measles5, total_pop=100_000, stop=ss.days(50))
msim = ss.parallel({'Infectious for 8 days': sim8, 'Infectious for 5 days': sim5})
msim.plot('measles.I')
for sim in msim.sims:
    print(sim.label, '- R0 =', round(sim.diseases.measles.R0(), 1))
MultiSim: 2 runs of 2 scenarios (Infectious for 8 days, Infectious for 5 days)
Done in 0.22 s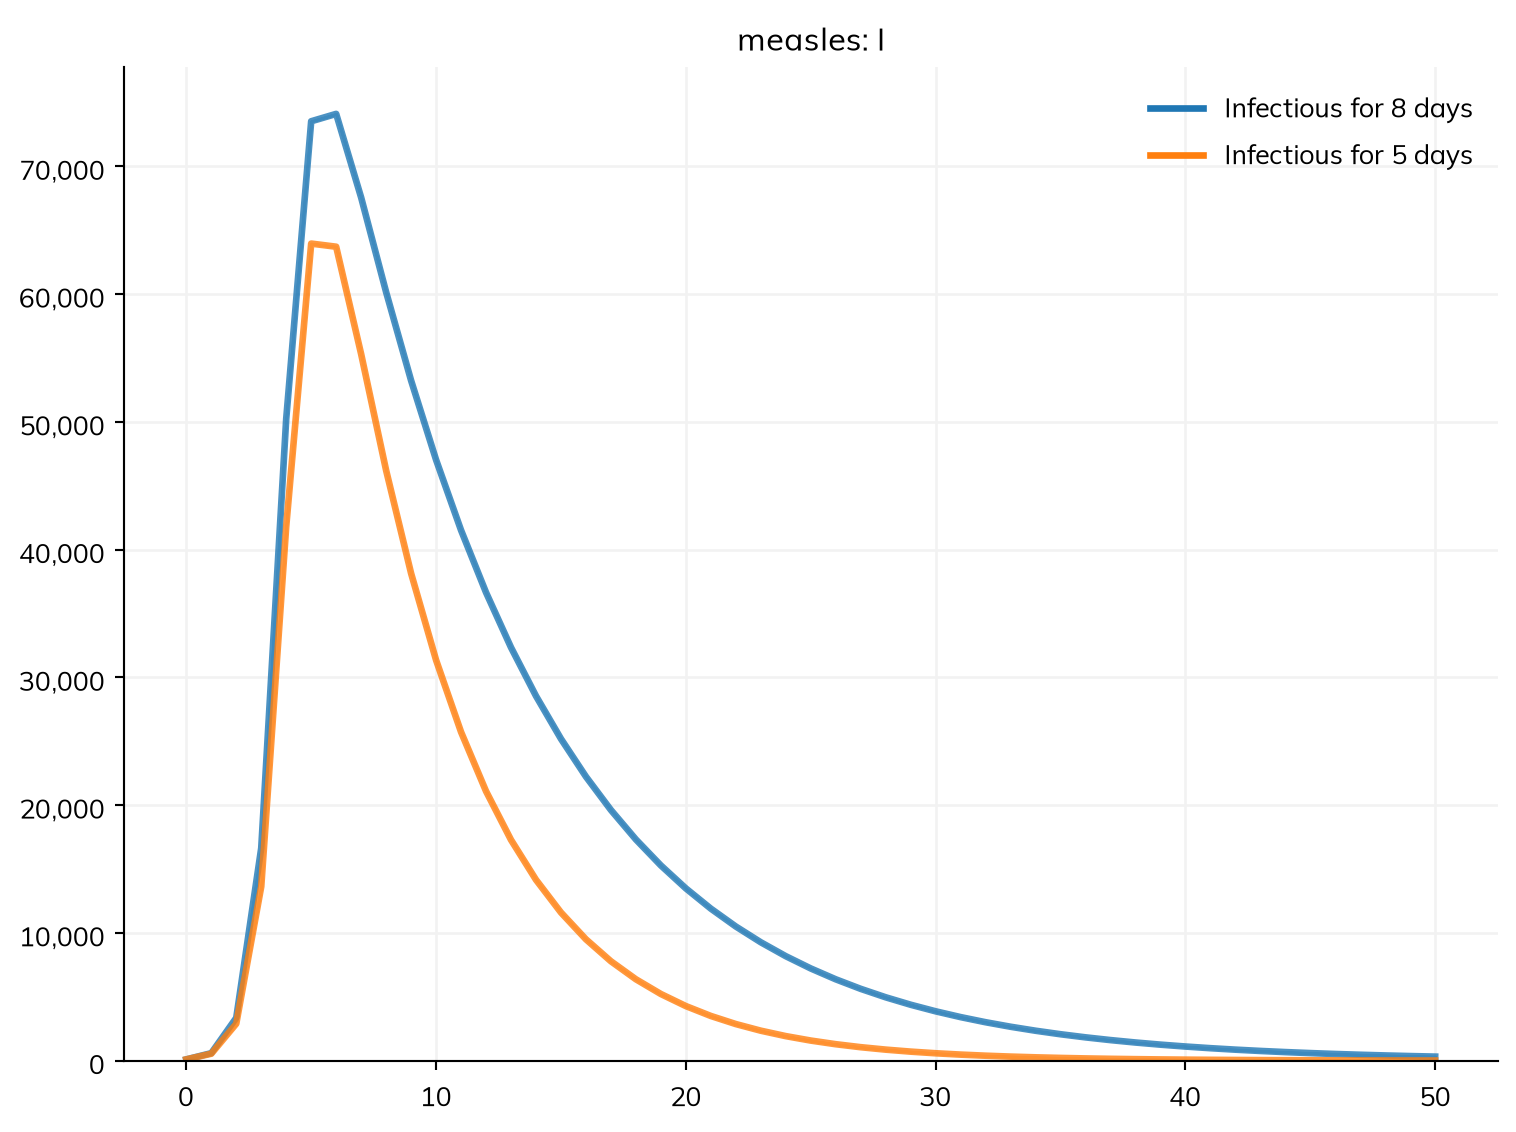
Infectious for 8 days - R0 = 15.2
Infectious for 5 days - R0 = 9.5
Exercise 2
Run the agent version of the model with 1,000 agents instead of 10,000 (each standing for 100 people). What changes in the plot, and why?
Surprisingly little: in an epidemic that infects almost everyone, even 1,000 agents follow the same course, differing by little more than chance. What changes is the detail: each agent stands for 100 people, so results move in steps of 100, and chance plays a larger part (try another rand_seed=). This matters most for small numbers, such as the first or last few cases of an outbreak.
S, I, R = ss.states('S I R')
infection = S >> I @ 1.9*I
recovery  = I >> R @ ss.days(8)
measles = ss.Disease(infection, recovery, init_prev=0.001)

many = ss.Sim(measles, total_pop=100_000, n_agents=10_000, stop=ss.days(50))
few  = ss.Sim(measles, total_pop=100_000, n_agents=1_000, stop=ss.days(50))
msim = ss.parallel({'10,000 agents': many, '1,000 agents': few})
msim.plot('measles.I')
MultiSim: 2 runs of 2 scenarios (10,000 agents, 1,000 agents)
Done in 0.35 s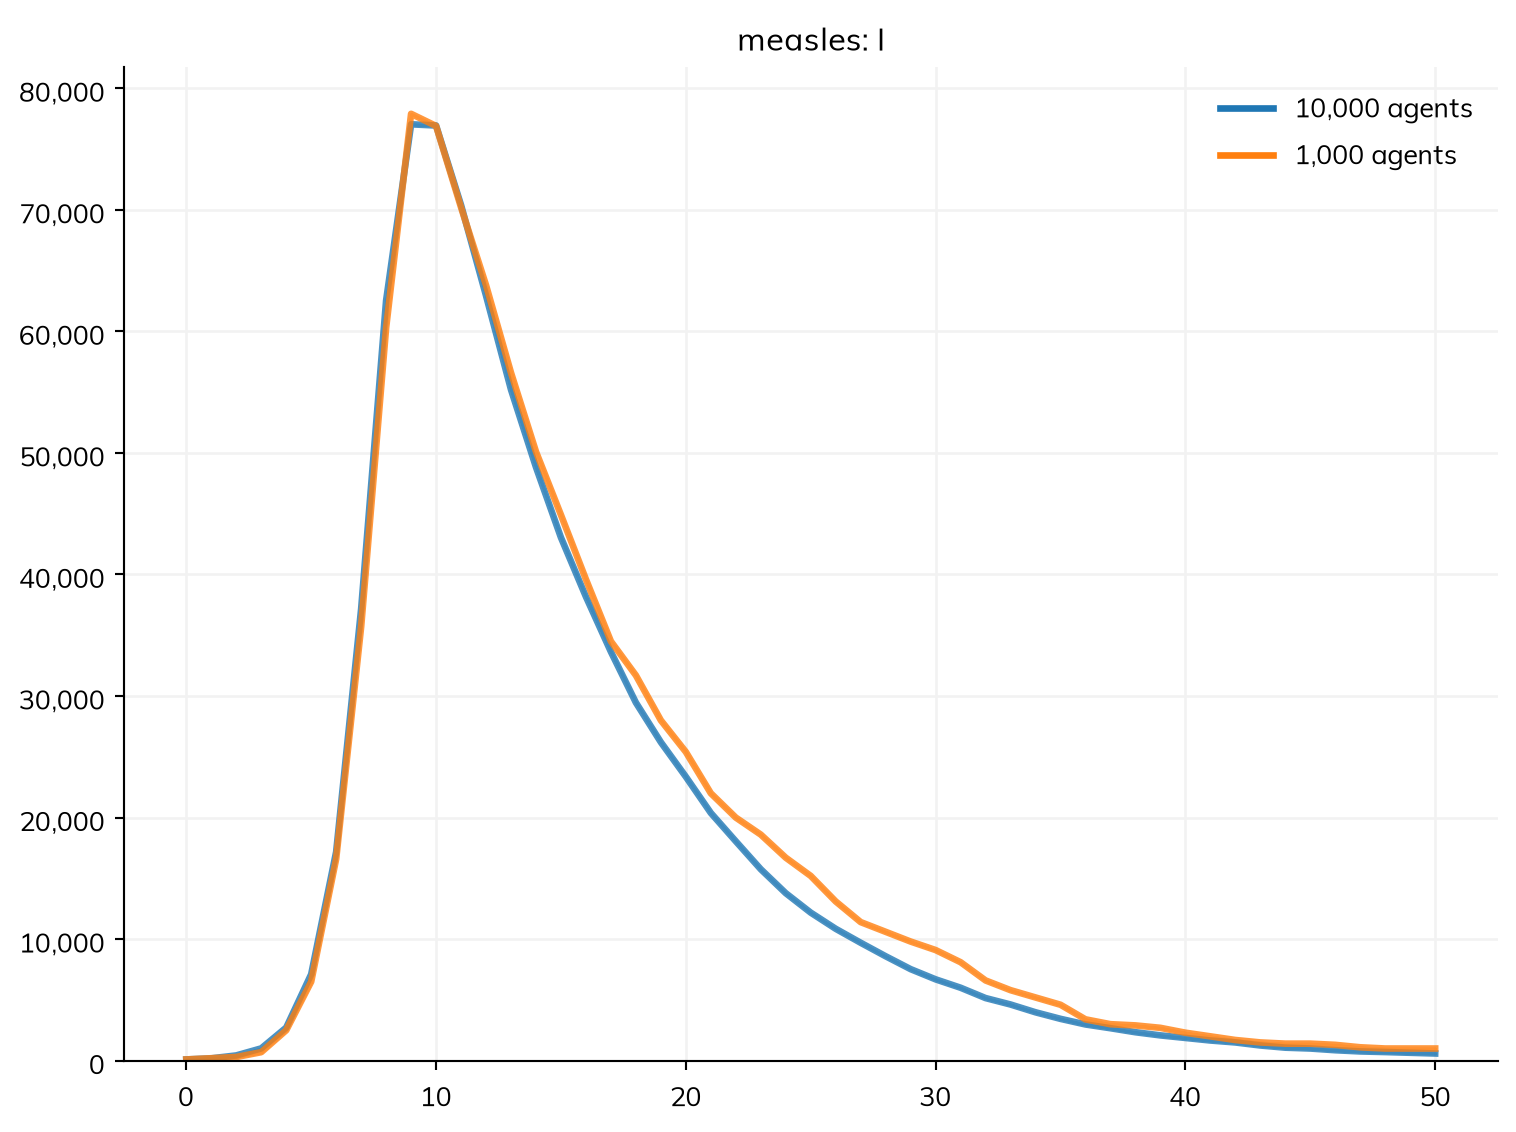
Exercise 3
Using the output of describe(), find out how Starsim assumes that people mix, and how long people stay infectious (the distribution as well as the average).
Under “Mixing and interventions”, describe() says mixing is homogeneous (everyone mixes with everyone equally), marked as guessed, since no contacts were given. Under recovery, the time in I is exponential with a mean of 8 days (time in I ~ exponential(mean = 8 days)), also guessed.
sim = ss.Sim(measles, total_pop=100_000, stop=ss.days(50))
sim.describe()
Sim 1 module, 100,000 people, days 0 to 50
| solver | ode | guessed: every part of the model has a compartmental form |
| unit | day | from the typed values in the model |
Disease 'measles' 3 states, 2 transitions
| states | S, I, R | |
| I infectious | ||
| init: init_prev = 0.001; the rest in S | ||
| infection | S -> I transmission, from I | |
| beta = 1.9 per day | ||
| rate = 1.9 × I.n / N | homogeneous mixing | |
| recovery | I -> R spontaneous | |
| time in I ~ exponential(mean = 8 days) | guessed: scalar duration |
Mixing and interventions
| mixing | homogeneous, 1 contact per day | guessed: no network given |
Results and running
| results | S, I, R, and one flow per transition; also infected, prevalence | |
| plan | measles: as compiled code, the whole run in one call | |
| schedule | every day: measles |
Notes
| note | unit='day' (from the typed values in the model) |
Per step of measles 1 day
| infection | beta = 1.9 per day → 1.9 per step | |
| recovery | rate 0.125 per day → p = 1 - exp(-0.125 × 1) = 0.1175 per step |